There is very little knowledge related to how floating windfarms effect the marine environment as this is such a new “product”. Thus, the data that we gathered on this cruise will be novel in that sense. The aim of the cruise was to look at possible effects of the windfarm on the marine environment. Based on limited cruise time and tough weather conditions around Hywind Tampen we had to be selective related to topics for this first cruise, and we choose to focus on the following: 1) Measuring noise from the turbine. This we did by deploying a hydrophone mooring within the windfarm. 2) Measuring current to track possible changes in current and wake effect. We did this by deploying ADCP’s within and around the windfarm, and by conducting CTD transects around and within the windfarm. 3) Look at possible effects on pelagic fish distribution, by conducting acoustics transects with RV G.O. Sars's multi-frequency acoustics, within and around the windfarm. As the RV G.O. Sars is not allowed closer then 500m to the turbines, we conducted acoustic transects with an acoustic kayak-drone within the 500 m range to the wind turbines. The kayak being allowed as close as 15-20m to the turbines. To able ground truthing of acoustic findings we trawled with an open trawl equipped with a camera (DeepVision) and we took eDNA samples along the transects. 4) Effect of bottom structure on the benthic fauna. This was studied by ROV transects filming fauna around 3 suction anchors and the adjacent chains connecting the turbines to the anchor. ROV control transects were conducted from the very same suction anchors, but on a line moving away from the windfarm. This cruise was conducted in collaboration with the NFR-funded WindSys project.
Cruise report Hywind Tampen 13 to 28 March 2023
— Cruise no. 2023001004 G.O. Sars
Report series:
Toktrapport 2023-10
ISSN: 1503-6294
Published: 24.08.2023
Cruise no.: 2023001004
On request by: Institute of Marine Research
Research group(s):
Fangst,
Økosystemakustikk,
Oseanografi og klima,
Bunnsamfunn
Subject:
Havvind
Program:
Nordsjøen
Research group leader(s):
Svein Løkkeborg (Fangst) og Rolf Korneliussen (Økosystemakustikk)
Approved by:
Research Director(s):
Geir Huse
Program leader(s):
Henning Wehde
Norsk sammendrag
Summary
1 Background
1.1 Hywind Tampen windfarm
Hywind Tampen is the first floating windfarm in Norwegian waters. It is owned by Equinor and is built to support Gullfaks and Snorre with renewable energy. With its seven turbines and four more to come it is the biggest, floating wind farm in the world. The plan is to finish the construction of the windfarm by the end of this year, with 11 turbines in total. There are two other floating windfarms in North Sea. The others being Kincardine Offshore Windfarm outside Scotland (2 turbines) and Hywind Scotland (5 turbines) the later also owned by Equinor. In addition, there is one turbine located at the test location at Karmøy: Unitech Zefiros (Previously Hywind Demo).
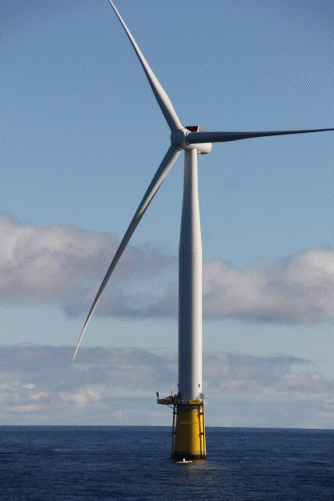
1.2 The Hywind Tampen turbine structure
(text and figures taken from Equinor report: Hywind Tampen PUD del II – Konsekvensutredning).
The wind turbines are a standard offshore wind turbines placed on a floating concrete base ( Figure 1 ). The blades are produced in fiberglass/epoxy. The turbines have a total height of approximately 190 meters from the bottom of the chassis to the centre of the nacelle. The distance between the sea surface and the blade tip is approx. 23 meters. The rotor has a diameter of 167 metres.
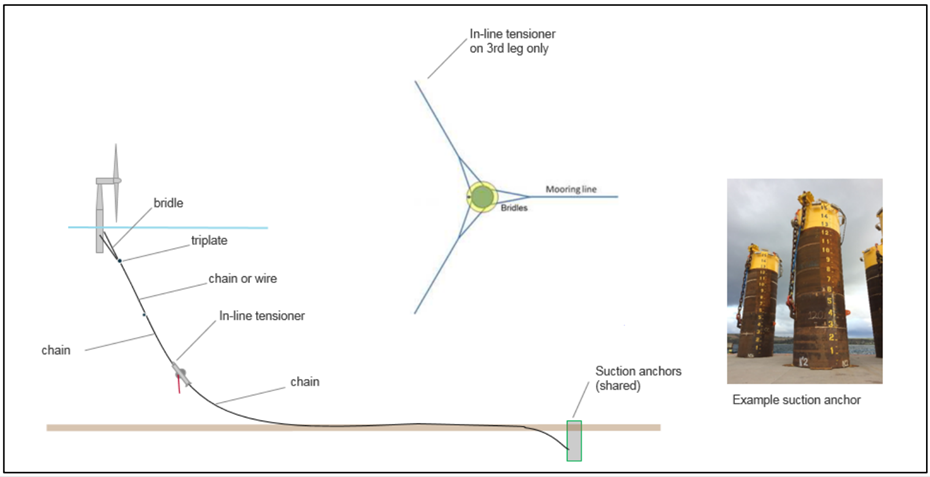
Each wind turbine is anchored to the seabed with three anchor lines consisting of steel wire and chain (138 mm). Each of the anchor lines extend approximately 800 meters from the installations and is moored to suction anchors on the seabed. A total of 19 suction anchors of which 9 act as common anchors for 2 or 3 turbines.
The wind turbines are linked together with power cables that run between the turbines (internal cables). The power cables hit the seabed 400 - 500 meters from the turbine. Where the power cables hit the seabed, a small anchor will be installed to hold the cables in place. The internal cables that link two wind turbines together will be around 2 km long. The export cables are static cables that are buried.
| Component | Design parameter | Size |
|---|---|---|
| Wind-farm | Area above surface | ~ 11 km2 |
| Area below surface | ~ 22 km2 | |
| Number of turbines | 11 | |
| Expected annual production | ~ 383 GWh | |
| Distance between the turbines | ~ 1.5 km | |
| Distance to shore | ~ 140 km | |
| Lifespan | 20 years (25 years technical lifespan) | |
| Wind- turbine | Effect | 8 MW |
| Total height from sea level to tip of rotor | ~ 190 m | |
| Rotor dimension | ~ 167 m | |
| Thorn height (from sea level to narcelle) | ~ 105-107 m | |
| Concrete undercarriage diameter bottom/top | ~ 18 m/ 9 m | |
| Distance between sea surface and rotor tip | ~ 22-23 m | |
| Volume of concrete undercarriage | ~ 3000 m3 | |
| Weight of concrete undercarriage | 8-9000 t | |
| Solid ballast (Olivin) | ~ 10000 t | |
| Water ballast | ~ 500 t | |
| Total weigt turbine + undercarriage | ~ 22500 t | |
| Subsurface depth | ~ 90 m | |
| Total weight (deplacement) | ~ 22600 t | |
| Anchoring system | Number of anchor lines per turbine | 3 |
| Length of anchoring line | ~ 900 m | |
| Diameter of anchor chain | ~ 138 mm | |
| Number of anchors | 19-33 | |
| Internal cables | Number | 11 |
| Length | ~ 2km | |
| Diameter | 150-200 mm | |
| Voltage transfer capacity | 36 kV / 50 MVA |
2 Cruise Timeline
Research crew and equipment was loaded from 08:00 13th of March, field full and returned to the harbour, to wait for the last equipment for the ROV arriving Bergen in the morning on the 14th of March. We left Bergen harbour 10:30 (Norwegian time).
On our way out Herdlefjorden, we tested the pelagic trawl (Harstadtrawl) and DeepVision. We also did a test dive with the ROV to make sure that the HIPAP worked.
15th of March - Arriving at Hywind Tampen at 00:30 – conducting the following.
-
Checking coordinate system Equinor contra G.O. Sars.
-
Deploying five ADCP moorings and one hydrophone mooring.
-
Had our first daily 08:30 meeting with Equinor.
-
ROV did the two chain transects on suction anchor 6 (SA06), a CTD vas taken to get the right density value for the acoustic HIPAP contact between the vessel and the ROV.
-
Acoustic fisheries transect line, from 500m to 19 nm from the windfarm on our way to Lerwick, Shetland.
16th of March ca 08:00 – Arriving in Lerwick, Shetland where we spend 24 hours in shelter of a storm.
17th of March ca 08:00 – Leaving Lerwick, Shetland.
-
On our way back to Hywind Tampen we conducted the acoustic fisheries transect. On which we had seven double CTD stations with water samples one for eDNA and one for nutrients (14 CTD stations). This transect was finished on the 18th of March.
18th of March –Started on the acoustic “ flower -transect” and CTD transects around the windfarm.
-
Acoustic transect in a flower shape around the windfarm, going in and out from the safety zone (500-860 m) to 5.4 nm from the turbines. During this transect we trawled with DeepVision when we saw something of interest on the acoustics. In total we conducted five trawl hauls during the flower transect.
-
CTD transect lines going from turbine HY06, HY04 and HY01, each consisting of five double CTD stations with water samples eDNA and nutrients. The CTD stations were at 500m, 0.54 nm, 1.08 nm, 2.70 nm og 5.4 nm from the three turbines. The flower transect was finished on the 20th of March.
19th of March – Continuing on the flower- transect with double CTD stations (see above) and ROV.
-
ROV, finishing suction anchor 6 (SA06) doing the two control lines. Further we did the entire survey on suction anchor 9 (SA09).
20th of March – Finished the flower transect with the double CTD stations. Acoustic transect with the KayakDrone, and ROV transects suction anchor.
-
The weather became much better, allowing us to conduct the acoustic transect within the windfarm with the KayakDrone, passing turbine HY11, HY10, HY09, HY08, HY07 on a 15-30 m distance. The KayakDrone holds a EK80 transducer.
-
ROV, conducting the entire survey on suction anchor 12 (SA12).
21st of March – Transect and CTD samples within the windfarm.
-
Trawling with DeepVision on the transect line – going between the two turbine lines.
-
Conducting three double CTD stations with eDNA and nutrients along the transect line.
-
Conducting three acoustic transect lines.
Redoing the fisheries transect this time with three trawl stations with DeepVision.
22nd of March – CTD transects.
-
Conducting three CTD transect lines of 8nm with 8 CTD stations each (1nm apart).
23rd of March – CTD transect and retrieving moorings.
-
CTD transect.
-
Retrieving ADCP and hydrophone moorings.
24th of March - Leaving Hywind Tampen.
-
Ca 07:30 Picking up glider, Slocum, for University of Bergen on our way back.
-
22:00 Returning to Bergen harbour.
A full overview of the different activities (stations) in terms of date, time, location (longitude and latitude), water depth, speed of vessel and weather conditions are given in Appendix (section 6).
To facilitate communication between G.O. Sars, Equinor operation room and service vessels on field, an Equinor Liaison Officer, Leonard Oliver Kielland; was mobilized onboard G.O. Sars for the entirety of the cruise. The responsibilities of the Liaison Officer consisted of preparing work permits for the different G.O. Sars operations within the vicinity of Hywind Tampen field, establishing communication with Sandsli Control room & other vessels, and to help plan G.O. Sars activities with other ongoing marine operations.
3 Activity
The first thing we did when we arrived at Hywind Tampen (HT) was to compare the coordinate system used by HT or Equinor with G.O. Sars system. To make sure that the positions we had on the Olex charting computer on G.O. Sars is comparable to Equinor’s system. G.O. Sars is using GWS 84, often referred to as «EPSG 4326» Units are in degrees Latitude and Longitude. Bridge personal prefers the DM-format, with degrees and decimal-minutes.
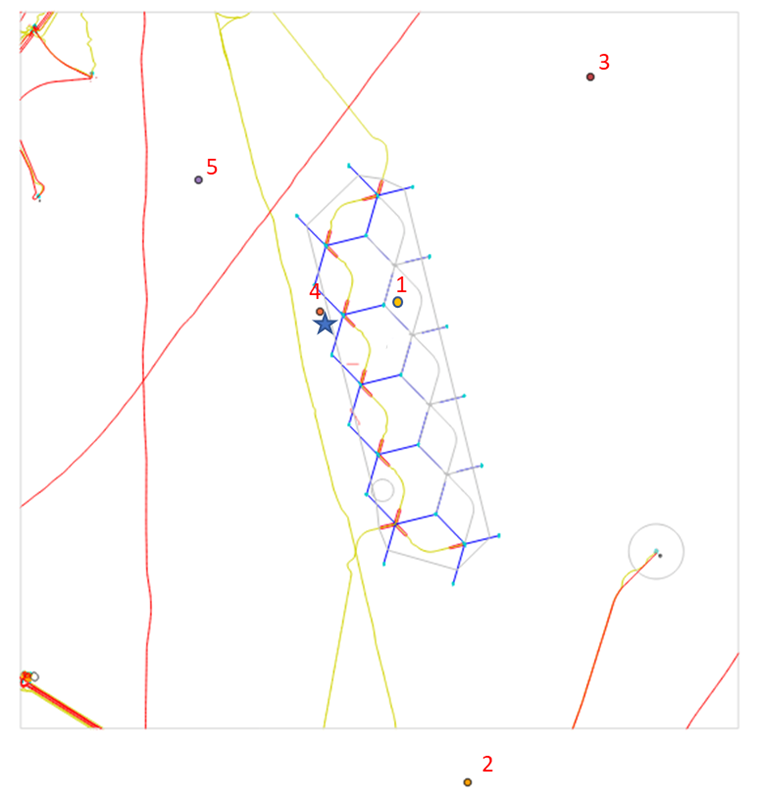
Following we will deploy the five ADCP and the hydrophone moorings. Three of the ADCP´s outside the windfarm and two ADCP´s and the hydrophone within the windfarm, see positions in the map Figure 2 and Table 2 .
3.1 Wind-driven circulation patterns in and around Hywind Tampen
Our aim was to investigate the impact of the modification of the wind field by wind energy extraction on ocean current speed and direction and potential implications for up- and downwelling. This is highly relevant for distribution of nutrients and planktonic organisms which form the base of the marine ecosystem. Model studies looking at impact of wind-wake effects from larger bottom mounted OWF in the shallow southern part of the North Sea has suggested large scale changes in annual primary production and bottom sedimentation (Christiansen et al. 2022; Daewel et al. 2022). However, whether these anthropogenically induced wind-wake causing abrupt changes in upwelling and downwelling are significantly different from the natural variability is still not clear (Floeter et al. 2022). There are so far no studies of current and wake-effects around deepwater floating wind farms. Thus, any data on this will be novel. We deployed five bottom-anchored moorings two in and three around the Hywind Tampen to collect observations of upper ocean currents in the area.
ADCP Mooring design, deployment and recovery
The moorings consisted of a Signature250 ADCP mounted in a float and attached by rope to an acoustic release which is attached by chain to a bottom anchor in form of train wheels (see Figure 3 ). ADCP1, 2, 3 and 5 had a CTD on their mooring, clamped onto the rope below the ADCP.
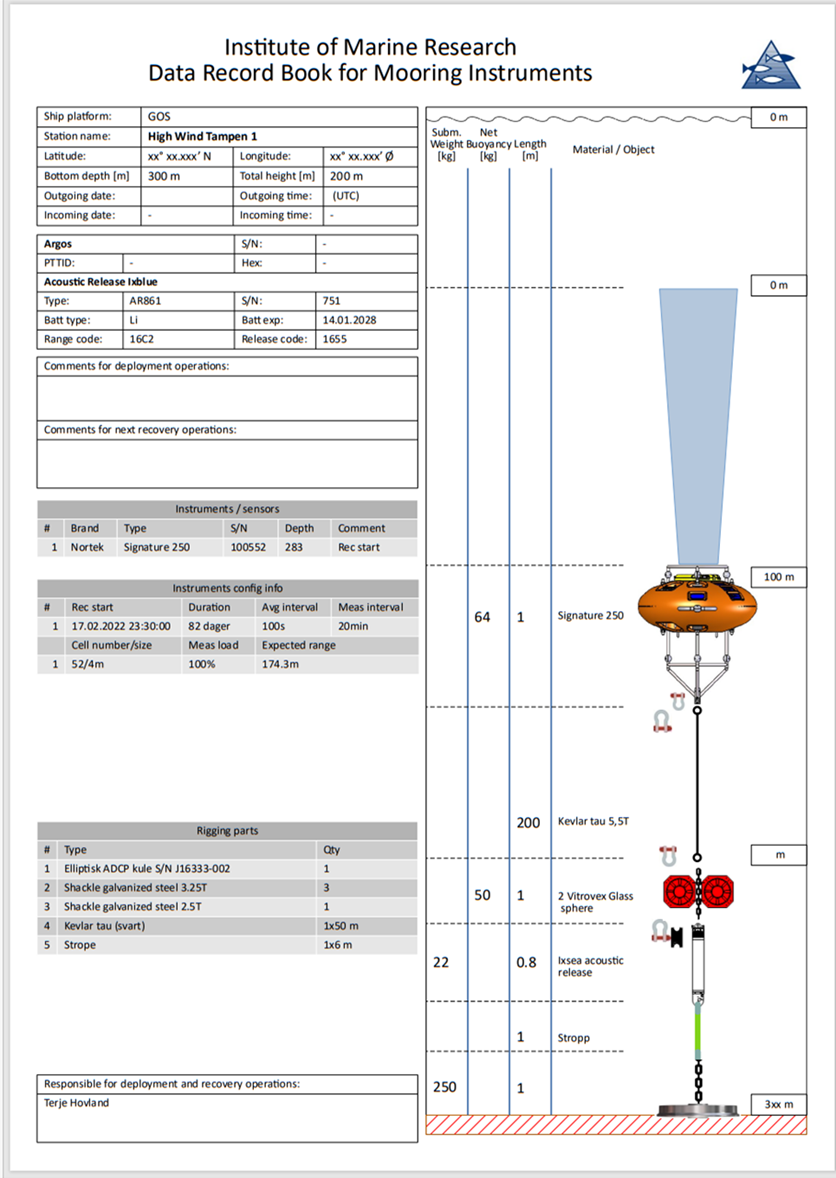
Deployment from G.O. Sars was done anchor-first to maximize control over position of the mooring and minimize risk of drift, following well-established procedures. For recovery we used the ROV to clamp a rope to the recovery hook on the top float, allowing us to winch in the mooring with anchor.
The moorings were deployed first day at Hywind Tampen (15th of march) and recovered at the end of the cruise on the 23rd of March.
| Mooring | Latitude | Longitude | Approx. bottom depth (m) | Comment |
|---|---|---|---|---|
| ADCP1 | 61° 20.789'N | 2° 15.610'E | 292 | Close to suction-anchor nr. 7 (SA07) |
| ADCP2 | 61° 15.384'N | 2° 17.351'E | 250 | 5km south of turbine nr 6 (HY06) |
| ADCP3 | 61° 23.367'N | 2° 20.045'E | 315 | 5km east/north-east of turbine nr. 1 (HY01) |
| ADCP4 | 61° 20.747'N | 2° 13.7579'E | 285 | |
| ADCP5 | 61° 22.132'N | 2° 10.892'E | 290 | 3km north-west of turbine nr. 11 (HY11) |
| Hydrophone | 61° 20.559'N | 2 13.664'E | 285 | Ca 500 m from turbine nr 10 (HY10) |
CTD transects
To get a better understanding of the water composition in the Hywind Tampen area, we conducted a three lined transects across the shelf ( Figure 4 black lines is transect with red triangles showing waypoints, coordinates for the waypoints are given in Table 3 ). We started on a fourth line with CTD stations, but after 3 stations bad weather conditions and bad weather forecasts made us stop the transect, and head for Bergen harbour. Each of the lines were going in south-west and north-eat direction, they were 21 nm long and had 8 CTD stations with 3 nm between stations (8 station in each line x 3 transect lines 24 CTD stations).
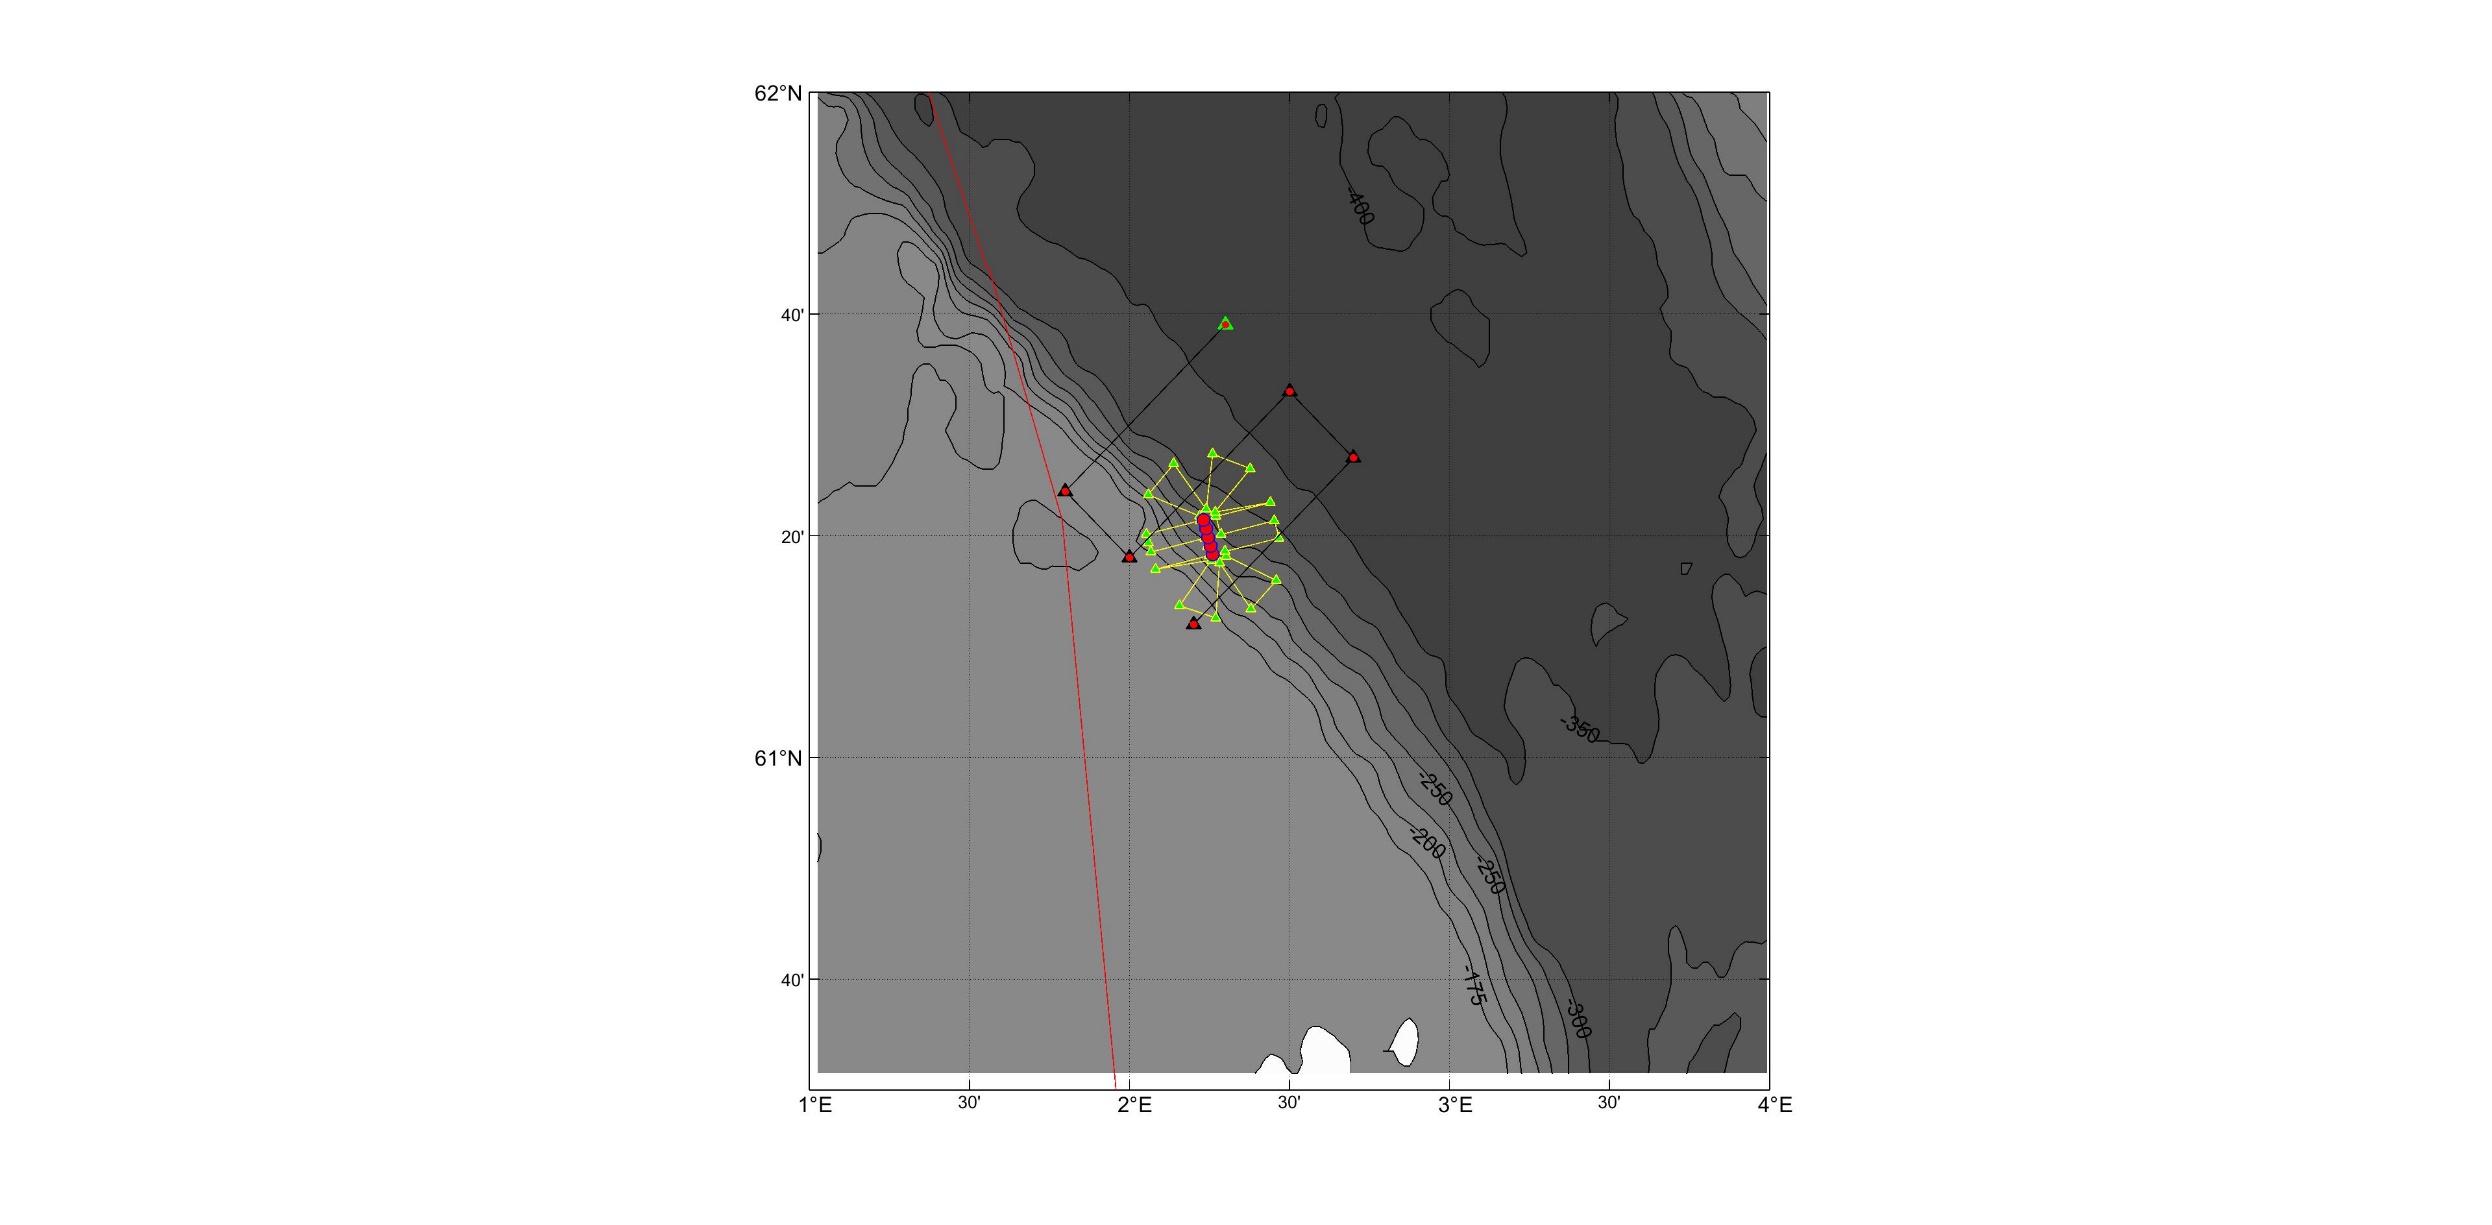
| Waypoint | Latitude | Longitude | Depth [m] | ||
|---|---|---|---|---|---|
| Start Northern line | N61° | 24.03’ | E001° | 48.17’ | 154 |
| Stop Northern line | N61° | 38.94’ | E002° | 17.83’ | 378 |
| Start Central line | N61° | 32.98’ | E002° | 29.91’ | 373 |
| Stop Central line | N61° | 18.01’ | E002° | 00.13’ | 147 |
| Start Southern line | N61 ° | 12.32’ | E002° | 09.72’ | 139 |
| Stop Southern line | N61° | 27.08’ | E002° | 40.91’ | 376 |
Preliminary results from CTD transects
(by Henrik Søiland)
Results from the CTD transect is given in Figure 5 below
![]()
a)
![]()
b)
Figure 5. The three CTD transect line going from shallow Tampen shelf across the drop to the Norwegian-trench. a) shows temperature, density, salinity, fluorescence and oxygen results from the northern transect, b) the central and c) the southern transect.
Nutrients
On all CTD stations, except for the across shelf CTD transect, we also took water samples to look at nutrients. We used IMR’s standard sampling depths: 5, 10, 20, 30, 50, 75, 100, 125, 150, 200, 250 og 300 m. In total 295 nutrient samples.
3.2 Operational noise and wind climatology
Noise and in particular continues noise is known to influence fish and other marine organisms’ behavior, physiology, and, in extreme cases, survival (Duarte et al 2021). Wind turbines produce continues noise when running. The noise depends on the turbine type and the fundament construction. Hywind Scotland’s turbine are made of steel, while the turbines at Hywind Tampen are made of concrete. Thus, we expect the turbines at Tampen to be less noisy, as concrete has a lower propagation of sound. A sound source characterisation study has been conducted at Hywind Scotland (Burns et al 2022), but not yet at Hywind Tampen.
Numerical studies suggest that turbine-induced modulation of wind forcing affects upper ocean thermal stratification and current locally around each individual turbine. How much this influences the directionality of near-surface sound propagation, specifically from the floating (direct-drive) wind turbines, needs to be studied. Meanwhile impacts of tides, precipitation and in general any variation of surface climate in the presence of turbines can play important role in near surface (sea-side) propagation of sound and spatial homogeneity of sound field. For example, tidal fluctuations cause vibration of equipment or the hydrophone beside the operating structure vibration. The directionality may change depending on type of foundation, farm layout, and frequency of noise (for example it is possible that in cross-wind direction and within the windfarm area, we get high SPL. Noise propagation can then have either omni-directional [1] or directional behaviour (Figure 6).
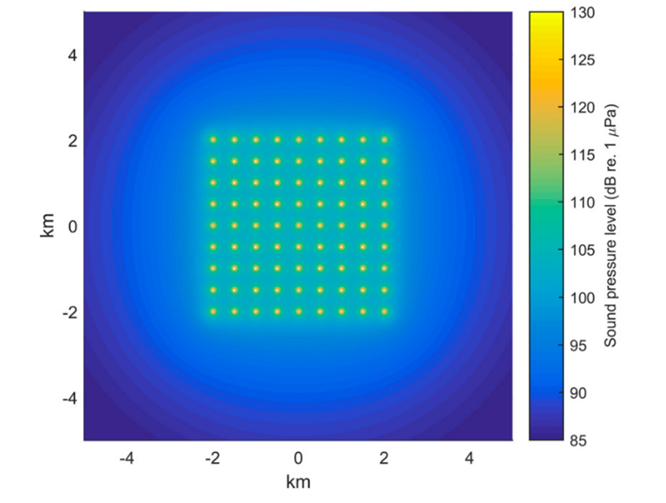
Regarding measurement of turbine-induced noise, vicinity to the turbine is a key factor. We expect very subtle sound (at a low level) from turbines even in distances less than 50-100m, during non-transient event conditions. The noise level reduces rapidly with distance (more than what is expected from simple spherical spreading – say more than 20dB/decade for a distance around 50m). Ship may generate a wide-band noise ranging from 25Hz to 1kHz (overlapping with low frequency turbine-emitted noise). It is therefore a concern that so much ship activity was going on in the near field to HY10 where the hydrophone mooring was located during the deployment period. As maintenance of this and the other turbines was conducted daily over the deployment period, except for the night and during 16th to 17th of March due to bad weather conditions.
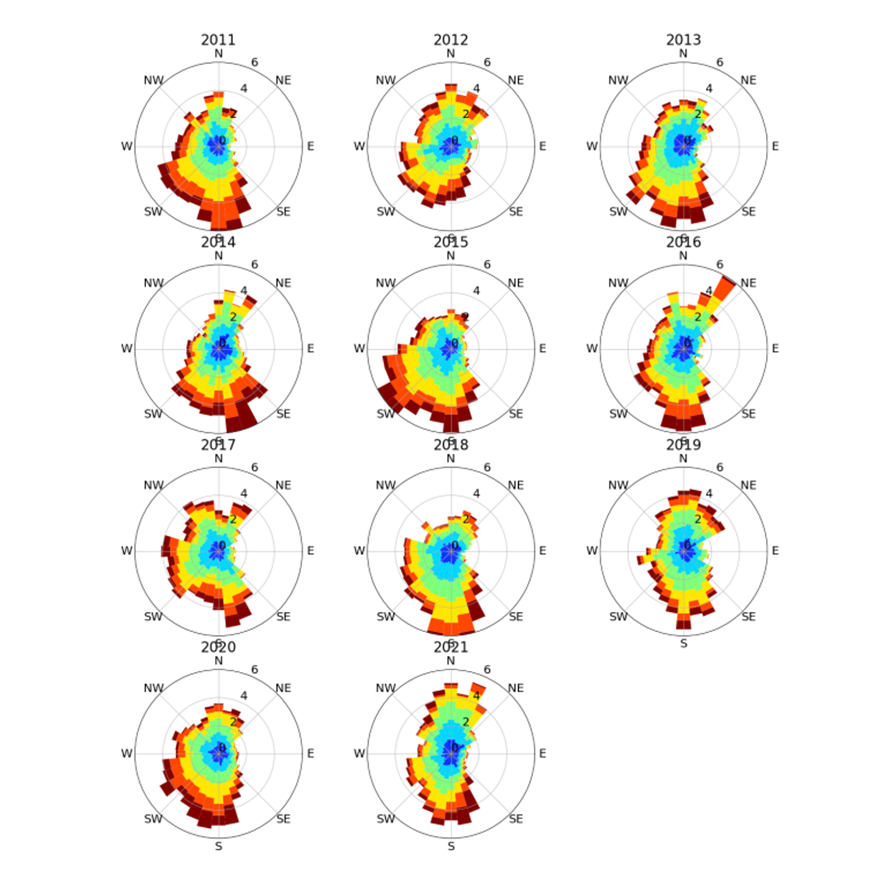
Wind climatology
Figure 7 shows 11 years timeseries of wind speed and direction. It suggests the dominant annual wind is coming from South (or slightly southwest). Changes in wind speed/direction and resulting wind stress change for a certain climatological condition can affect both stratification (then soundscape) and upper ocean current. In such condition, we have directionality that its strength depends on wind farm layout and other factors. Time series of wind speed and direction show, however, complex variability with a pronounced south-westerly wind. In this deployment, we assumed the sound propagation to be omni-directional and according to the wind direction we should get better noise recording inside the windfarm. As the park so far have only 7 turbines all on one long string, the hydrophone was placed close to one of the central turbines (HY10) in the chain of turbines (blue star in Figure 2).
Hydrophone mooring design
The hydrophone mooring consisted of three hydrophones and CTD mounted in a float and attached by rope to an acoustic release which is attached by chain to a bottom anchor in form of two train wheels (see Figure 8 ). The hydrophones were two SoundTrap 300 HF (Oceaninstruments.co.nz) hydrophones, and a RTSYS hydrophone. The two Sound traps were clamped on the mooring rope, one at 45 m and one at 35 m below surface. The RTSYS Hydrophone was positioned at 25 m, and the buoy at 15-16 m depth.
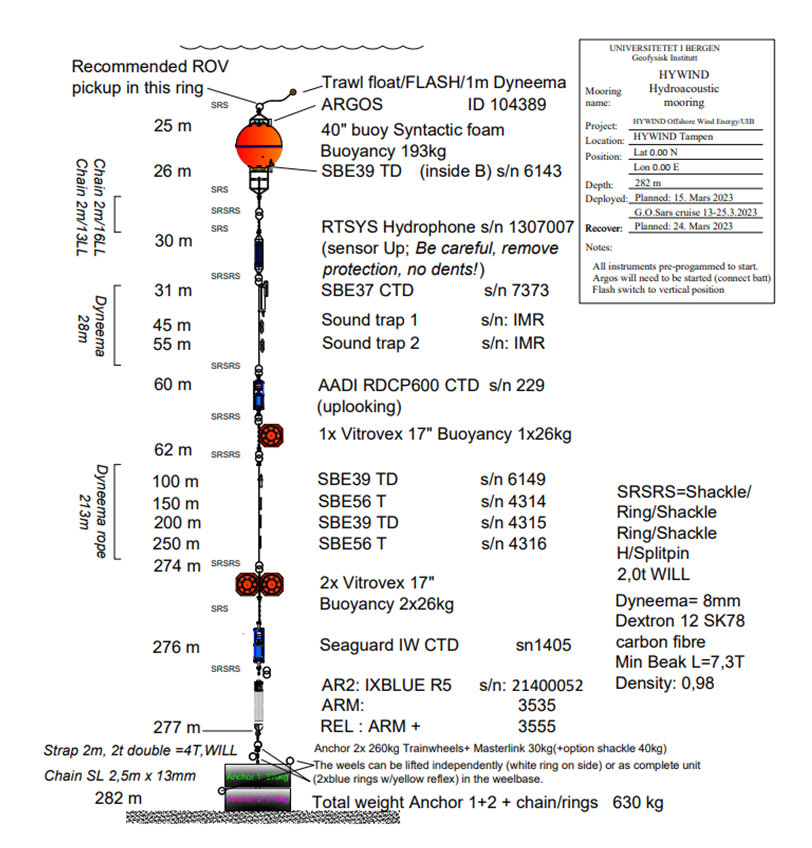
Positioning of the hydrophone
We deployed the hydrophone moorings anchor first from the ship hangar traverse beam block winch. Lifting the instruments off deck and overboard in order to avoid twist/stress from contact with the ship at any part of the operation. Recovery was done using the ROV to clamp a rope to the steel frame under the buoy and pulling the mooring (including anchor) up.
Recorder configuration
For all hydrophones the recording was autonomous for the record dates between 13 and 23 of March. For the duration of campaign, we use 1 sampling channel, duty cycle 50 min on and 10 min off every hour. Sampling rate was 5000 kHz. We used 18 Li-SOCl2 batteries covering the recording period.
The two SoundTraps were sampling continuously, with a sampling rate of 48 kHz.
The hydrophone data has not yet been analysed.
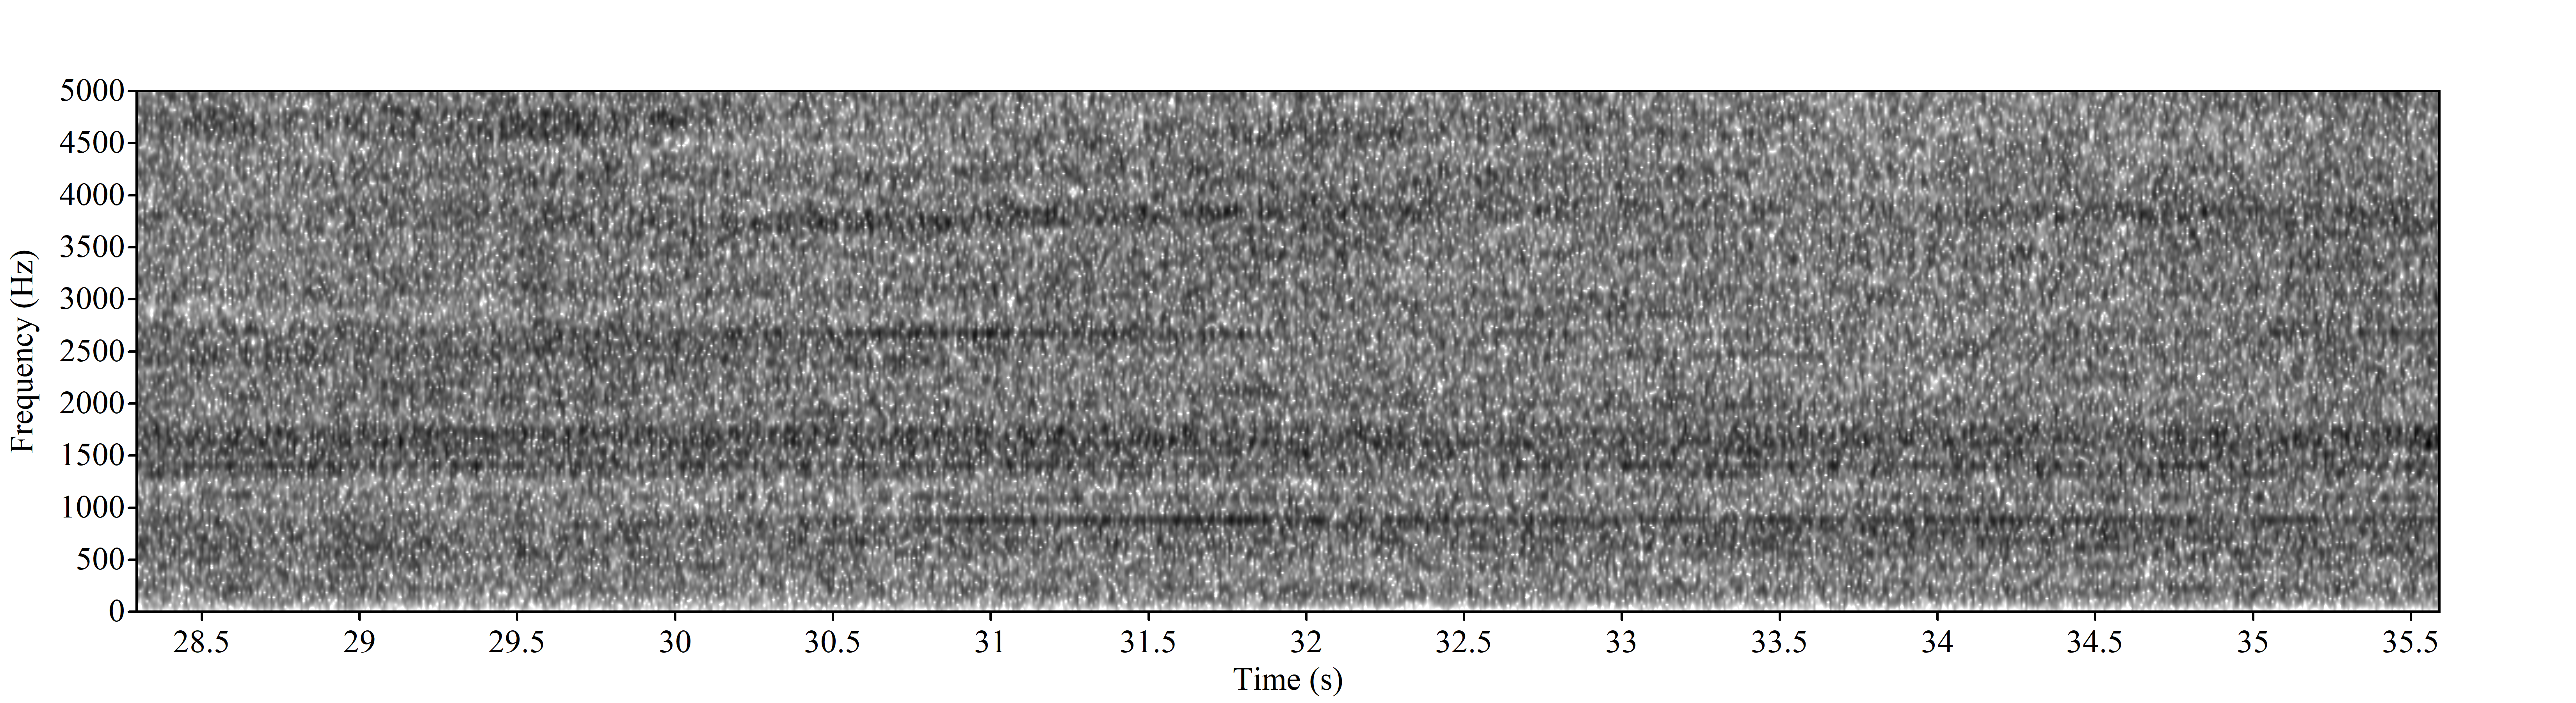
Preliminary results from the sound measurements
(by Karen de Jong)
Preliminary results from a representative 10s recording from one of the SoundTrap hydrophones (Figure 9) shows two broadband noise bands, one between ~200Hz – 1000 Hz and an additional broadband band around 1500 Hz. In addition, we see several transient tones, the lowest frequency tone was at around 800Hz. Important to note: At this preliminary stage we can’t be shore that these sounds are from the wind-turbines.
3.3 Acoustic study of pelagic fish
Hywind Tampen might attract fish due to all the added hard structure (called Reef-effect ) or it might scare fish away by noise and activity. Likewise, are floating structures used to aggregate pelagic fish in fisheries, a device called FAD (Fish Aggregation Device). We, therefore, wanted to look at any possible attraction or avoidance effect of fish by conducting multi-frequency acoustic transect, within and around the windfarm using G.O. Sars. The acoustic transects were: 1) from Hywind Tampen safety zone (500 m) to a distance of 5.4 nm from the farm, in all directions ( flower transect , see Figure 15 ), 2) from the safety zone on the west side of the farm to 19 nm in a south-west direction ( fisheries cruise transect, see Figure 11 ), 3) through the windfarm (see Figure 13 ), 4) KayakDrone transect close to the turbines ( Figure 18 ).
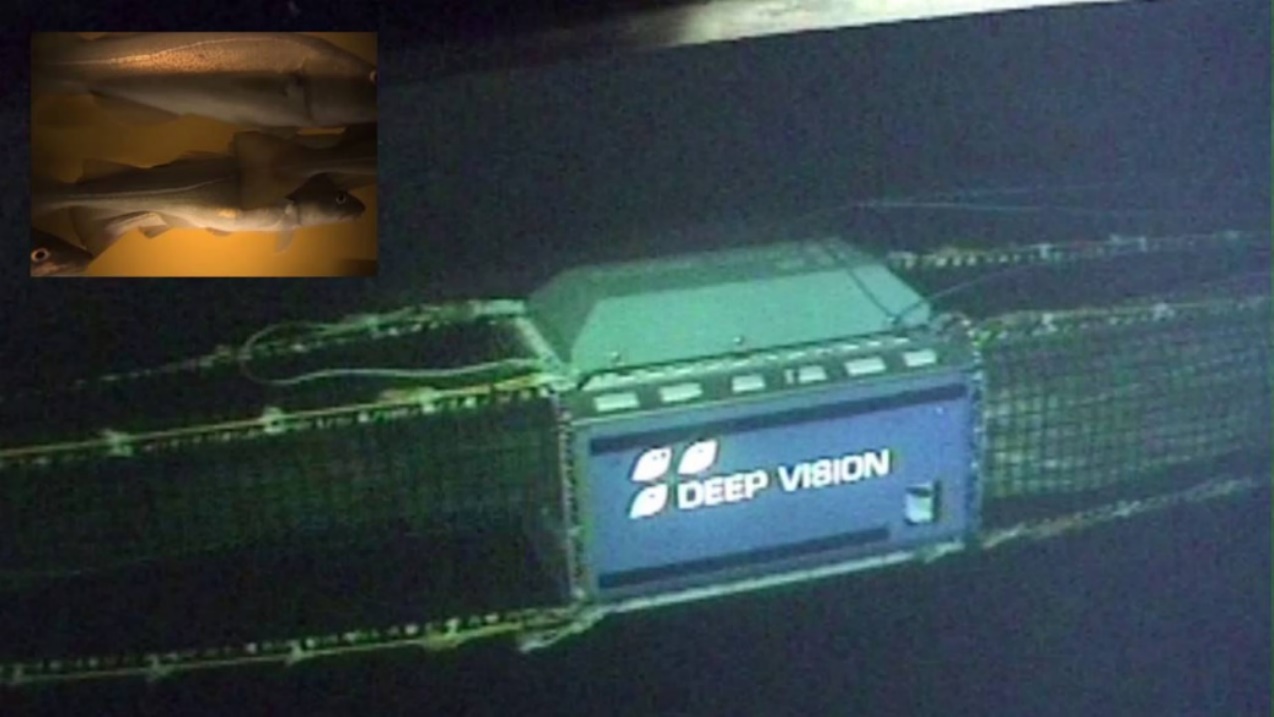
To ground truth what we saw on the acoustics we took pelagic trawl samples using an open-ended pelagic Harstad trawl with a camera unit called Deep Vision. The later takes pictures of the catch as it passes through the trawl (DeepVision Figure 10 ). In addition to trawling with DeepVision on the line of the acoustic transect, were eDNA samples taken at given CTD stations along the acoustic transect (see section 3.5 on eDNA ).
Fishery cruise transect
We conducted an acoustics transect following the fisheries surveys gill-net station lines going from the windfarm towards south-west, stopping at the U.K. bordar, starting at ca 500 m from Hywind Tampen to ca 19 nm (from station 2 to station 8 in Figure 11 ). This acoustic transect was repeated 3 times during the cruise.
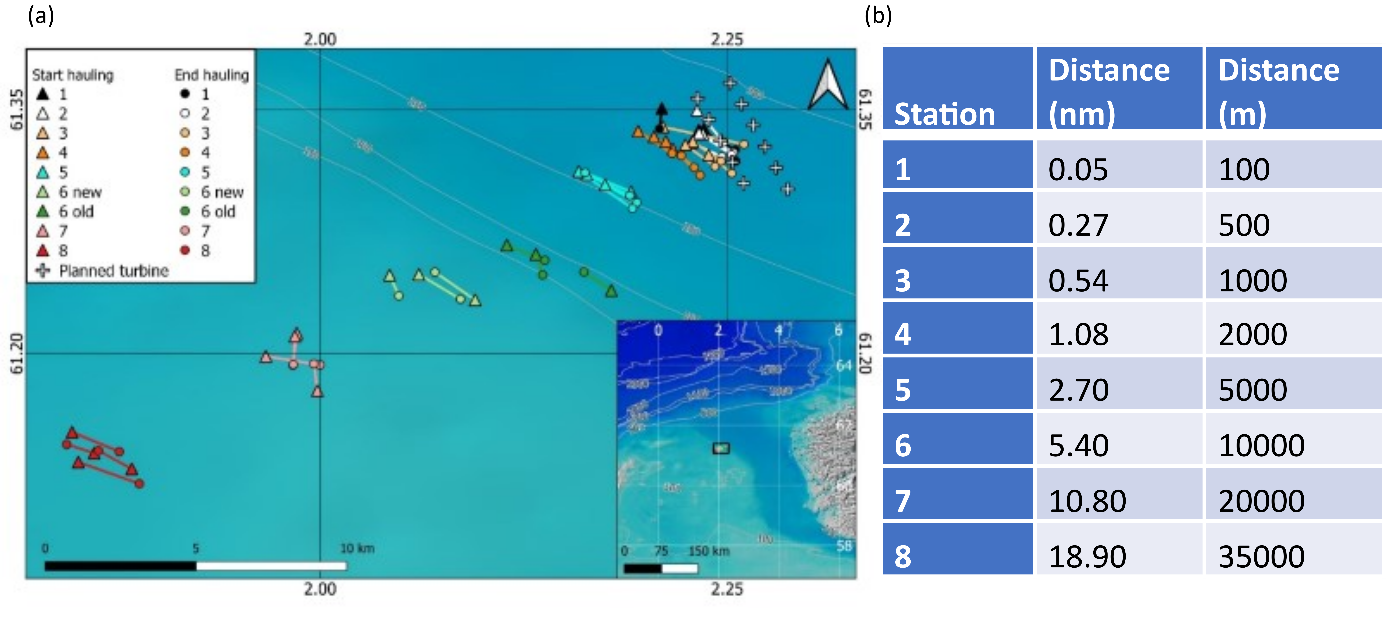
In the same position as the gillnet stations in the fisheries cruise 2022 we took CTD and water samples to get nutrients and eDNA ( Table 4 ).
| Station | Latitude | D | min | longitude | D | min |
|---|---|---|---|---|---|---|
| 2 | 61 | 19,630 | 2 | 14,330 | ||
| 3 | 61 | 19,4474 | 2 | 14,08997 | ||
| 4 | 61 | 19,4638 | 2 | 12,97851 | ||
| 5 | 61 | 18,1175 | 2 | 10,70873 | ||
| 6 | 61 | 14,4884 | 2 | 04,0351 | ||
| 7 | 61 | 11,7862 | 1 | 59,23628 | ||
| 8 | 61 | 08,118 | 1 | 51,7036 |
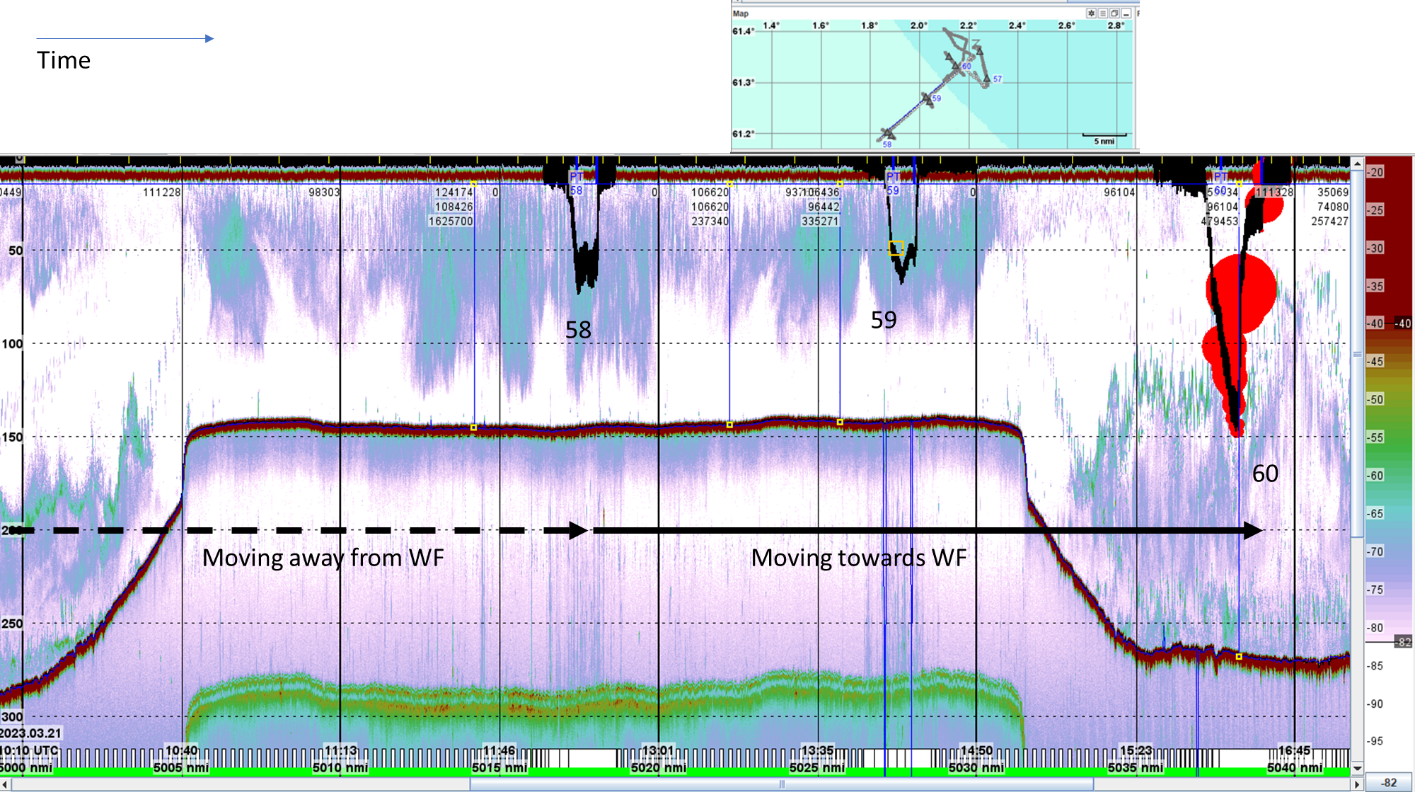
Preliminary results from DeepVision during the fisheries cruise transect
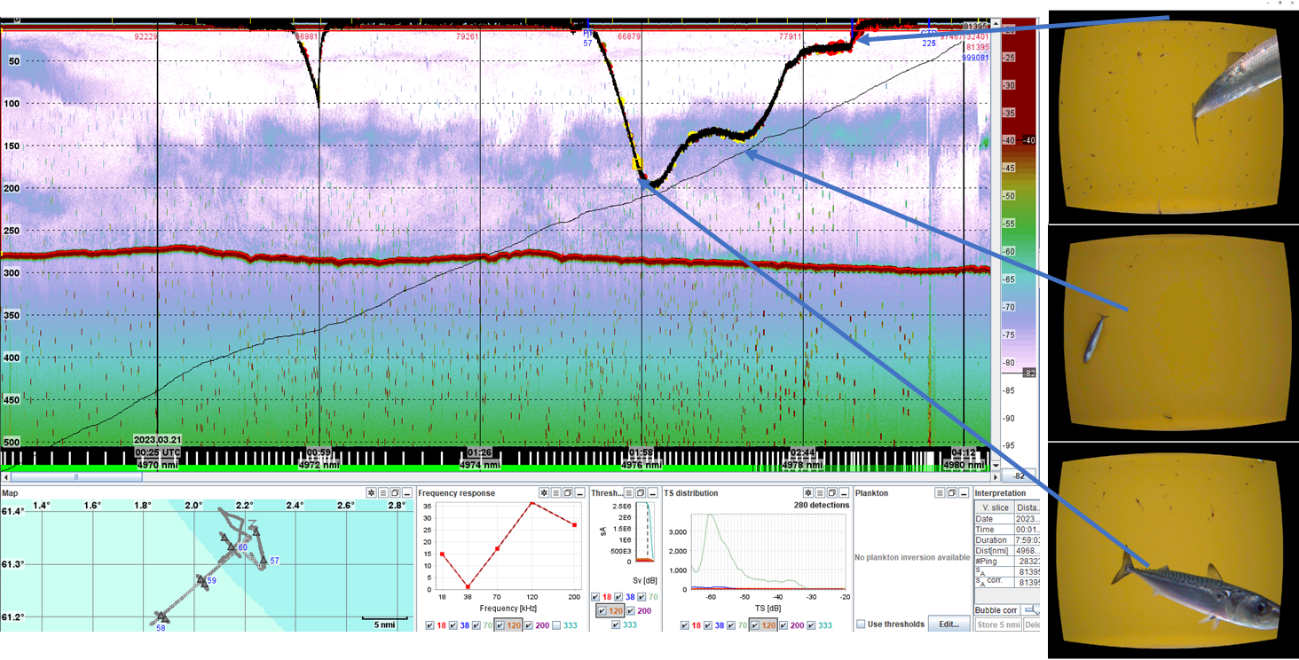
We sampled different sound scattering layers (SSL) three times during the fisheries transect using DeepVision ( Figure 12 ). This revealed that there was jelly in the SSL layers furthest away from the windfarm (station 58 and 59 in Figure 12 ), while there were mesopelagic fish (pearl sider, Maurolicus muelleri ) in the SSL layer as we got closer to the farm (station 60 in Figure 12 ).
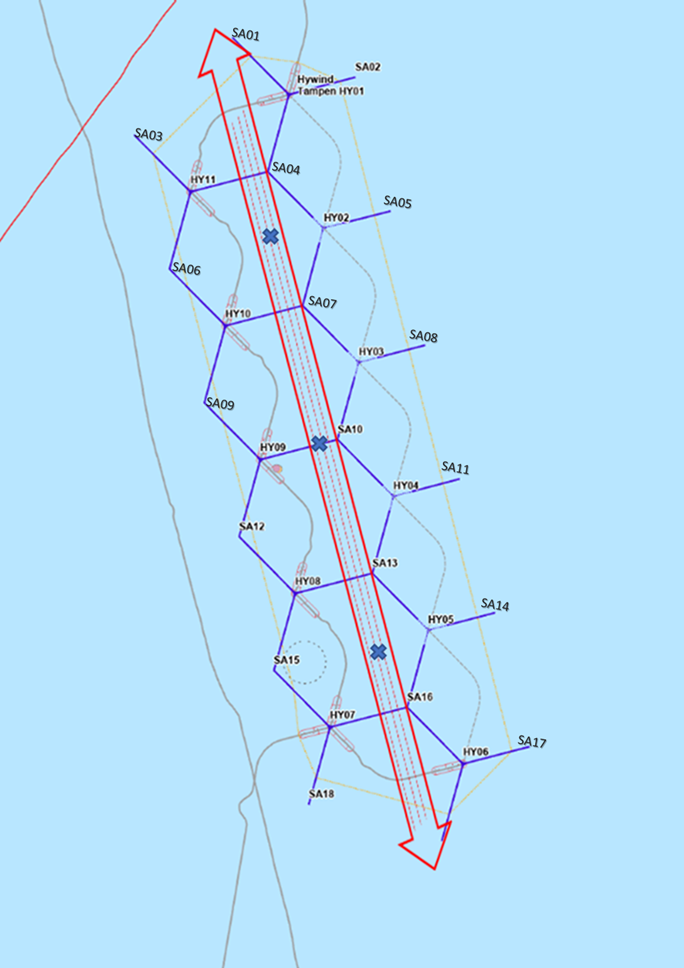
Acoustic transects within the windfarm
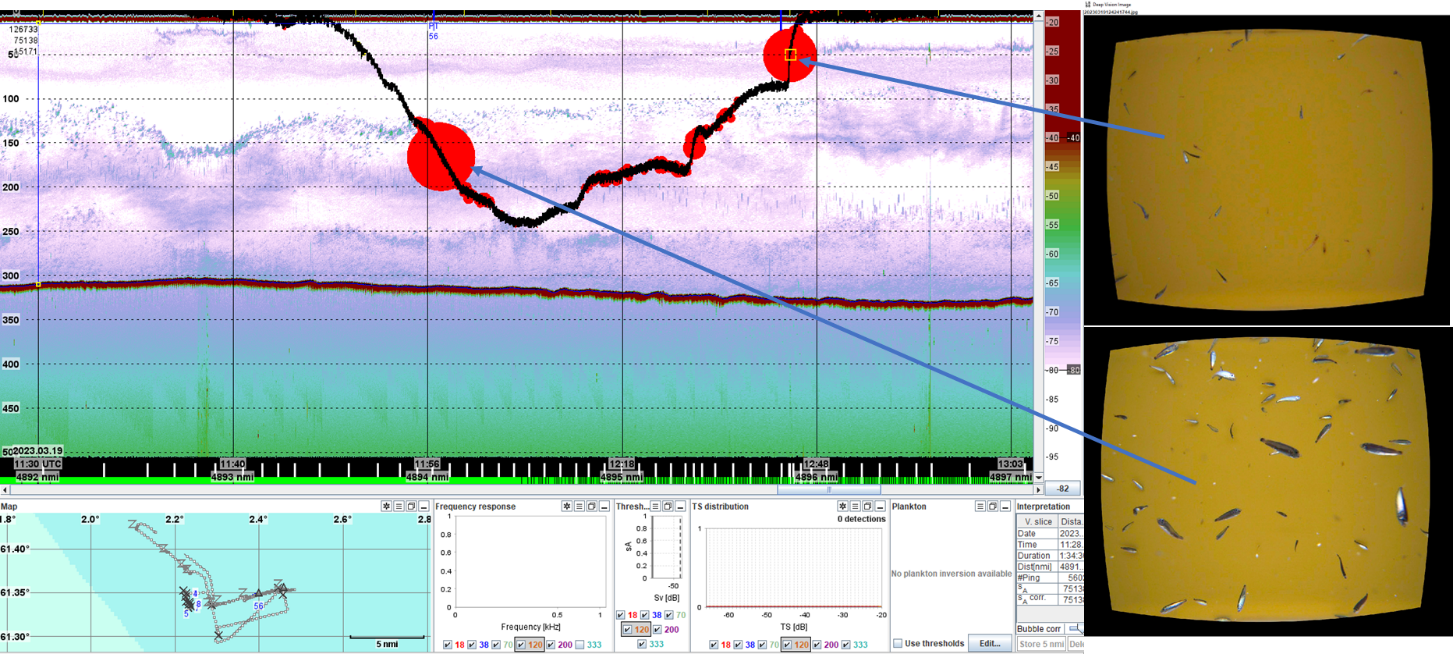
We conduct four transect within Hywind Tampen. The acoustic transects went through the windfarm following the red arrow in Figure 13 , using the trawl only in safe places related to 500 m to turbines, anchor-chains and our own moorings (maximum depth 50 m depth). The transect lines were on the western side of central row of suction anchors. Here we stayed within a distance of 200 m from the suction anchors. The trawl was at surface or close to surface when entering and leaving the windfarm. Do to mostly poor weather conditions we only got a chance to trawl trough the windfarm once, and that was during the night.
Prelimenary results from DeepVision during transect inside the windfarm
DeepVision showed that we had pelagic fish (herring and mackerel) in the upper 200 m ( Figure 14 ). CTD stations, with water samples for collecting nutrients an eDNA were also taken inside the windfarm (stations marked with X in Figure 13 ).
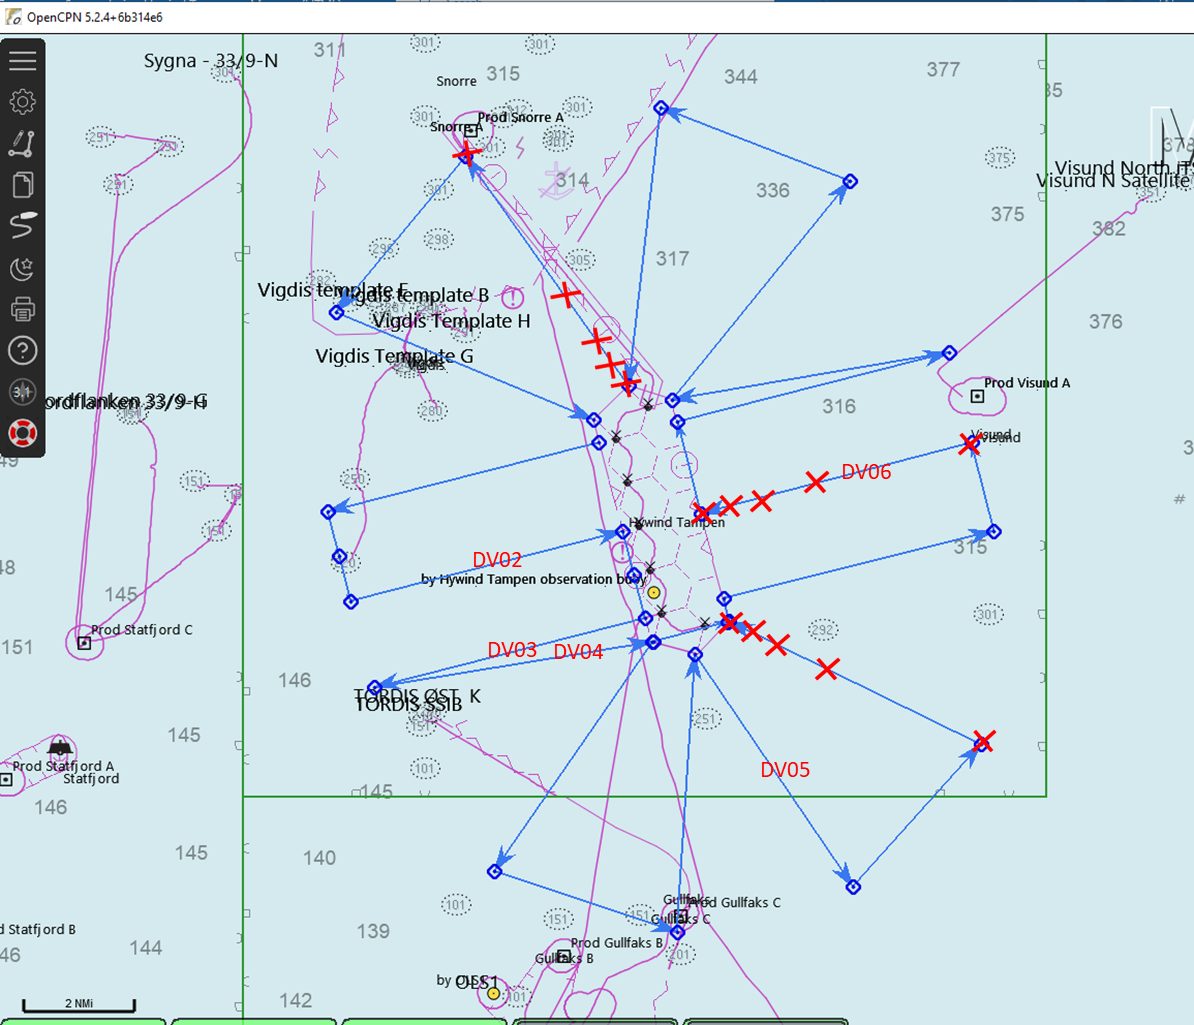
Acoustic transect around Hywind Tampen, flower transect
We started our flower transect at 500 m distance to the turbines and conduct transects outwards to 5.4 nm from Hywind Tampen. Also here, we trawled pelagic with a Harstad trawl equipped with DeepVision, to ground truth what we saw on the acoustics. In addition to trawling, we took CTD, nutrients and eDNA samples at given distance to the north, east and south of the wind farm (stations marked with red crosses on the transect lines in Figure 15 ), vest was covered by the CTD, nutrient and eDNA stations taken along the fisheries transect ( Figure 11 ).
The transect design is a compromise between design for quantity calculation (more or less homogeneous coverage) and gradient study from the windfarm. Total length of transect is ca 105 nm ( Figure 15 ).
Preliminary results from DeepVision during flower transect
All five DeepVision trawl stations (DV02 to DV06) showed mesopelagic fish present in the sound scattering layers (SSL’s) from 200m and up around Hywind Tampen ( Figure 16 )
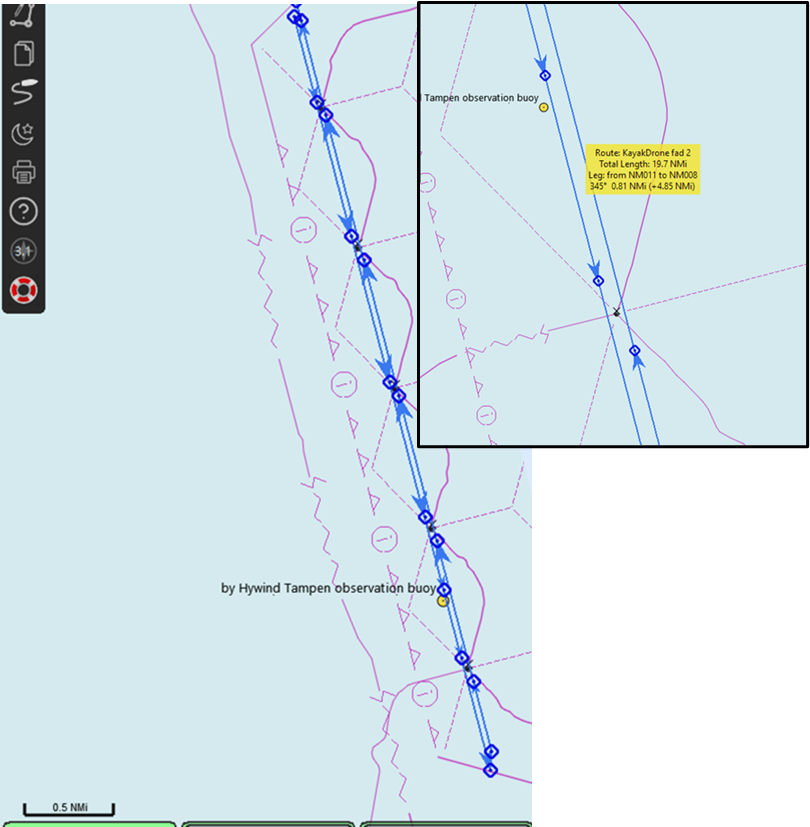
Acoustic KayakDrone transects
We used an acoustic KayakDrone ( Figure 17 ) for acoustic sampling close to the turbines. Previous research has shown that structure in the water has a reef-effect , and that this effect is seen close to the structure (<20 m from the turbines Methratta and Dardick 2019, < 50–150 m from oil installations Løkkeborg et al. 2002, Vold Soldal et al. 2002). Fish are attracted as they find food and shelter around the structure and in the current wake behind structure. Likewise floating structure is used in fisheries to aggregate fish (the so-called FAD, Fish Aggregation Devise). Both the reef - and FAD effect is seen in the near range to the structure, and with G.O. Sars we were not allowed closer than 500 m to the turbine. We therefore used an acoustic KayakDrone to look at fish abundance as close as possible to the turbines. The KayakDrone moves in a pre-set rout. It has an electrical outboard engine that makes it silent, and it holds a EK80 200 kHz transducer.
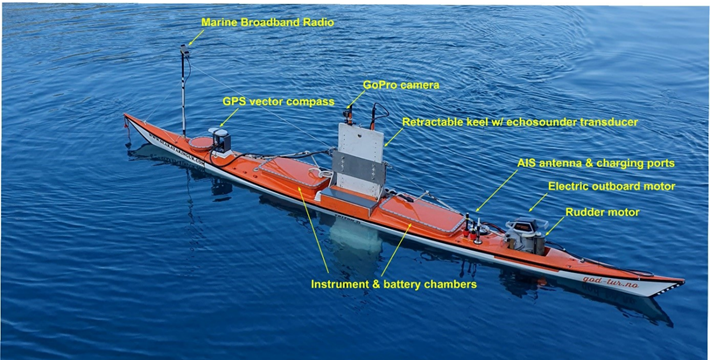
KayakDrone transect design
The design is based on the fact that in this experiment the FAD is not a single point (which is most common), but rather a cluster of FADs in an area. It is therefore likely that the fish aggregation effect of one turbine is not independent or unaffected by the surrounding wind turbines.
The design involves the passage of five turbines, and on two sides, with a distance of 30 meters from the centre of the turbine. The turbines are 10 m in diameter. Wind and current can offset the turbines position by ca 10 m, which gives a passing distance of 15 to 25 metres.
When making the rout for the KayakDrone we entered a waypoint (WP) just before arriving at a turbine (see Figure 18 ). This was done as wind and drift can cause the kayak to move in a bent line from one WP to the next, especially if there is a long distance between WPs. The extra WPs ensure that the kayak is on the correct track just before it passes the turbine. Further to reduce the damage if something goes wrong and there is a collision, we reduced the speed of the kayak from 5 to 2 knots when passing a turbine.
When picking up the KayakDrone we needed to use the mob-boat of G.O. Sars, given that to get the kayak back on board we needed to get the lifting hook connected to the kayak, and this could only be done from the mob-boat. We therefor needed good weather conditions to use the KayakDrone, something we were blessed with on the 20th of March ( Figure 19 ).
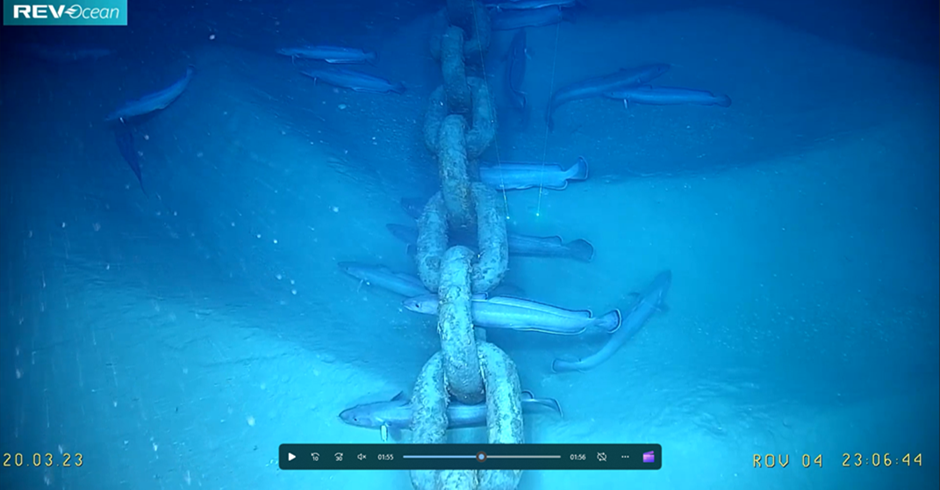
3.4 Bottom studies in Hywind-Tampen
The aim was to gain more knowledge about the effects of floating offshore wind farms on the bottom environment. The wind turbines at Hywind Tampen are secured /strapped to the soft bottom by suction anchors and chains. The anchors, chains and the 90 m deep submerged concrete part of the wind-turbines facilitate a new type of habitat in this softbottom area. A habitat that we expect will be colonised by hard bottom species, resulting in an additional food sources and shelter for higher tropic levels (Lindboom et al 2011) reef effect . Causing aggregation and colonisation of species close to the novel substrate. Studies have shown that ecosystem processes and properties can be sensitive to changes generated by OWF installations (Burkhard et al., 2011) and thus alter food webs.
Microbial community and pollutants can be an issue in OWF (Wang et al., 2023). We therefore took core samples at our ROV stations.
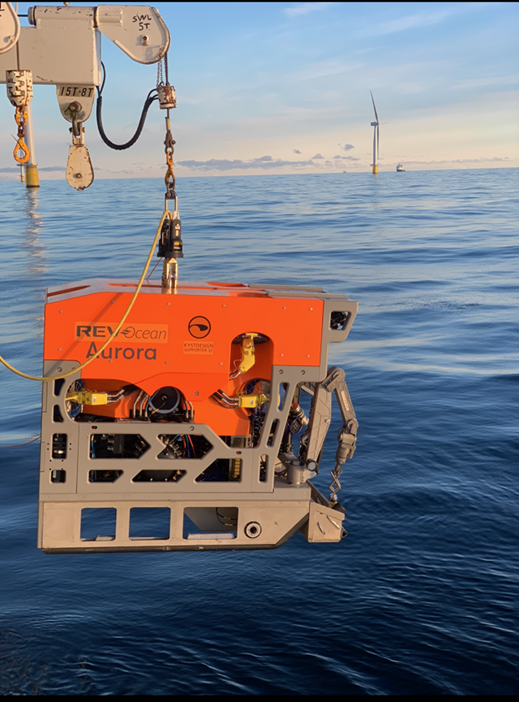
ROV activities
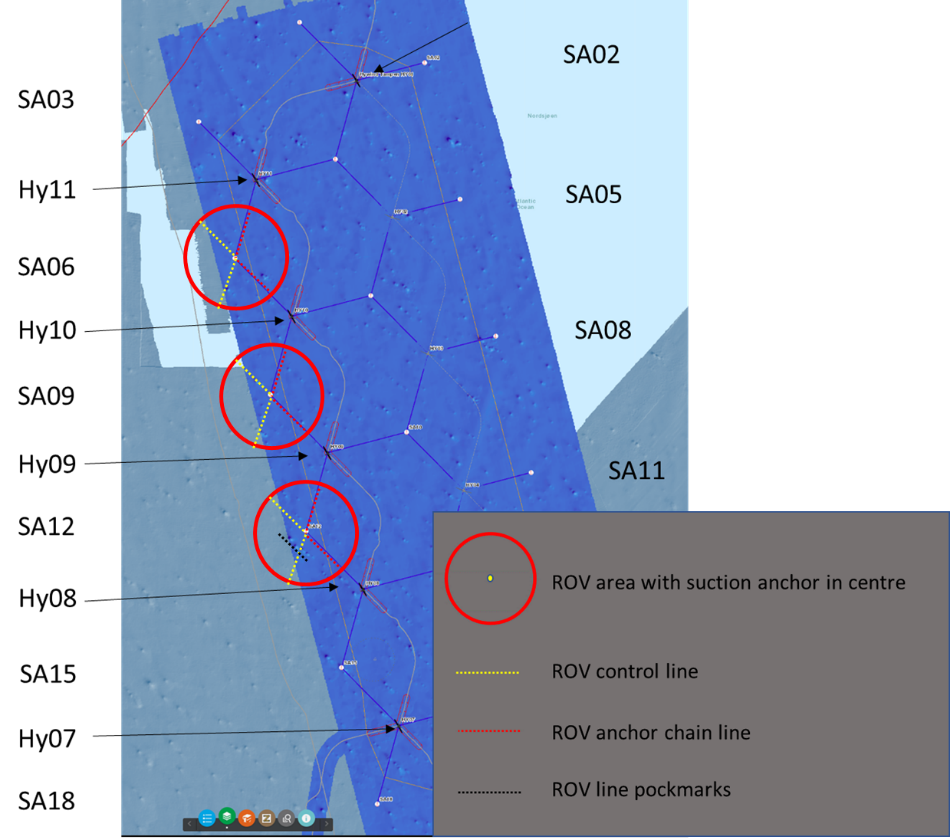
Suction anchors and anchor chains: We used a ROV (Figure 20) to study the area around three suction anchors and along their anchor chains for a length of 500 m, if possible, from the anchor position. Correspondingly, we mapped the same distance away from the wind farm area as a control. This was done at three anchor sites: SA06, SA09, SA12 ( Figure 21 , for transect coordinates see Table 5 ). The investigations include video filming of the bottom outside and rounded the three suction anchors and their anchor chains. The area where the chain is mowing on and off the bottom is of particular interest. A sample of the bottom sediment was taken with a small corer from the ROV at each site. We also planned to do a video transect along some pockmarks next to SA12 (line id 13 in Table 5 ), however, lack of time with good weather conditions limited our ROV study. We chose to prioritise the chain and chain control transects. Furthermore, there was a request for additional 63 ROV stations randomly placed around the wider area to be completed if there was time and with lower priority, but again due to weather conditions these could not be completed.
| id | Lat | Long | Type | line_id | comments | Lat_Deg | Lat_Decmin | Long_Deg | Long_Decmin |
|---|---|---|---|---|---|---|---|---|---|
| 1 | 61.35263473 | 2.2208763 | ROV line end point | 1 | accurate enough | 61 | 21.1580838 | 2 | 13.252578 |
| 2 | 61.34944191 | 2.2274465 | ROV line end point | 1 | accurate enough | 61 | 20.9665146 | 2 | 13.64679 |
| 3 | 61.35375949 | 2.2299206 | ROV line end point | 2 | accurate enough | 61 | 21.2255694 | 2 | 13.795236 |
| 4 | 61.34942927 | 2.2274593 | ROV line end point | 2 | accurate enough | 61 | 20.9657562 | 2 | 13.647558 |
| 5 | 61.34504478 | 2.2250276 | ROV line end point | 3 | accurate enough | 61 | 20.7026868 | 2 | 13.501656 |
| 6 | 61.34938577 | 2.2274723 | ROV line end point | 3 | accurate enough | 61 | 20.9631462 | 2 | 13.648338 |
| 7 | 61.34619263 | 2.2340412 | ROV line end point | 4 | accurate enough | 61 | 20.7715578 | 2 | 14.042472 |
| 8 | 61.34937505 | 2.2274882 | ROV line end point | 4 | accurate enough | 61 | 20.962503 | 2 | 13.649292 |
| 9 | 61.33957884 | 2.2279873 | ROV line end point | 5 | accurate enough | 61 | 20.3747304 | 2 | 13.679238 |
| 10 | 61.33637235 | 2.2345517 | ROV line end point | 5 | accurate enough | 61 | 20.182341 | 2 | 14.073102 |
| 11 | 61.34070092 | 2.2370246 | ROV line end point | 6 | accurate enough | 61 | 20.4420552 | 2 | 14.221476 |
| 12 | 61.33638374 | 2.23455 | ROV line end point | 6 | accurate enough | 61 | 20.1830244 | 2 | 14.073 |
| 13 | 61.33198798 | 2.23212 | ROV line end point | 7 | accurate enough | 61 | 19.9192788 | 2 | 13.9272 |
| 14 | 61.3363166 | 2.2345923 | ROV line end point | 7 | accurate enough | 61 | 20.178996 | 2 | 14.075538 |
| 15 | 61.3331341 | 2.2411412 | ROV line end point | 8 | accurate enough | 61 | 19.988046 | 2 | 14.468472 |
| 16 | 61.33632953 | 2.2345799 | ROV line end point | 8 | accurate enough | 61 | 20.1797718 | 2 | 14.074794 |
| 17 | 61.32651995 | 2.2350869 | ROV line end point | 9 | accurate enough | 61 | 19.591197 | 2 | 14.105214 |
| 18 | 61.32331441 | 2.2416445 | ROV line end point | 9 | accurate enough | 61 | 19.3988646 | 2 | 14.49867 |
| 19 | 61.32764222 | 2.2441221 | ROV line end point | 10 | accurate enough | 61 | 19.6585332 | 2 | 14.647326 |
| 20 | 61.32332517 | 2.2416476 | ROV line end point | 10 | accurate enough | 61 | 19.3995102 | 2 | 14.498856 |
| 21 | 61.31893016 | 2.2392128 | ROV line end point | 11 | accurate enough | 61 | 19.1358096 | 2 | 14.352768 |
| 22 | 61.32327029 | 2.241676 | ROV line end point | 11 | accurate enough | 61 | 19.3962174 | 2 | 14.50056 |
| 23 | 61.32007517 | 2.2482353 | ROV line end point | 12 | accurate enough | 61 | 19.2045102 | 2 | 14.894118 |
| 24 | 61.32325802 | 2.2416898 | ROV line end point | 12 | accurate enough | 61 | 19.3954812 | 2 | 14.501388 |
| 25 | 61.32070743 | 2.2431306 | ROV line end point | 13 | intends to cross pockmarks!! | 61 | 19.2424458 | 2 | 14.587836 |
Preliminary results from ROV studies of anchor chains and suction anchors in Hywind Tampen wind farm
(by Anne Kari Sveistrup)
ROV station HT01 (15.03.23 kl 15:17)
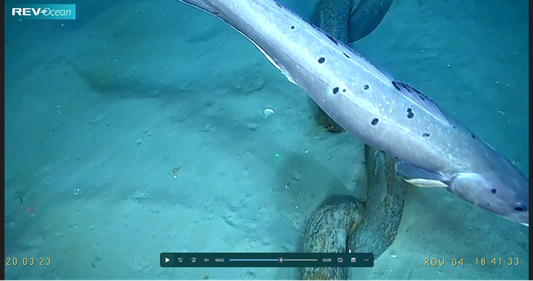
Going 500m South-East from SA06 towards HY10, on the anchor chain. The chain never rises from the sea floor, but more traces of chain movement at the last part of the transect. Push core was taken close to the suction anchor (core sample CHT01).
Not much epifauna are seen on the suction anchor.
Gracilechinus (sea urchin) dominating the first part of the transect, with Spatangus purpureus (sea urchin), Parastichopus tremulus (sea cucumber), Paguridae (hermit crab) and Ditrupa arietina common (Polychaeta). Asteroids (starfish) partly buried in sediment, and species like Leptasterias muelleri (starfish) are living on the chain.
Of fishes were Norway pout (Trisopterus esmarkii) and silver cod (Gadiculus argenteus) most common, but also ling (Molva molva), tusk (Brosme brosme), saithe (Pollachius virens), cod (Gadus morhua), greater forkbeard (Physis blennoides), bluemouth (Helicolenus dactylopterus) and various flatfish were recorded.
Litter, like plastic strips was seen on top of sediment that covered anchor chain.
ROV station HT02 (15.03.23 kl 17:29)
Going North-East from SA06 along the suction anchor chain for only 375m of expected 500, due to chain movements, suspended sediments and low visibility. Push core taken at the end of 375m where sea floor was disturbed by the chain (core sample CHT02). Muddy sand.
At the first part of the transect, we followed the depression from the chain. The chain is visible, and gradually ascending from the sediments a way into the transect. Crustaceans like hermit crabs (Paguridae), squat lobsters (Munida sp.), and crabs (Brachyura) together with tusk (Brosme brosme) and ling (Molva molva) are hiding in and under the chain. Different starfish and a few gastropods are living on the chain. Around in the sediments small echinoids/sea urchin (Gracilechinus acutus) and hermit crabs are most common. Both hermit crabs living in empty gastropod shells (Pagurus pubescens and P. alatus) and in Suberites sp. sponge (Pagurus bernhardus) were observed. For a part of the transect there was a clear difference in numbers of small sea urchins (Gracilechinus sp.) on each side of the chain, with the highest number on the western side. Buried starfish, brittle stars, sea urchin (Spatangus purpureus) and sea cucumbers (Parastichopus tremulus, Bathyplotes natans and Mesothuria intestinalis) were seen along the transect.
Norway pout (Trisopterus esmarkii), silver cod (Gadiculus argenteus), greater forkbeard (Phycis blennoides), tusk (Brosme brosme) and ling (Molva molva) and various flatfish are spotted throughout the transect. Saithe (Pollachius virens) were following and feeding in the light from the ROV.
Fucus fragments were lying in the depression from the chain, so were plastic strips.
ROV station HT03 (19.03.23 kl 15:06)
Control transect starting from suction anchor SA06, going North-West for 500m off the chain. The first 50 m we were a bit off the line. Flat area.
Muddy sand with some burrows. Small sea urchin of genus Gracilechinus sp. dominating the whole line, but also some Spatangus purpureus (sea urchin) here and there. Various Asteroidea (starfish) including Luidia sarsii, Pontaster tenuispinus and Pseudarchaster parelii. Paguridae (hermit crabs), Parastichopus tremulus (sea cucumber), Ditrupa arietina (“sjøtann”, Polychaeta), and a few polychaeta tubes were also spotted on the way.
Dogfish (Galeus melastomus), ling and tusk around suction anchor. Flatfish (Glyptocephalus), Norway pout (Trisopterus esmarkii), silver cod (Gadiculus argenteus), were common along the transect. Three dogfish (Galeus melastomus) seen in total. A few saith (Pollachius virens) attracted by light, but mostly following behind us, also that in the light.
Taking a core (core sample CHT03) and picking up an Asteroidea at the end of the line, later identified as Pseudarchaster parelii up on deck.
Going back to suction anchor for next control transect.
ROV station HT 04 (19.03.23 kl 17:28)
Control transect, a 500 m transect going from suction anchor, SA06 South West off the chain.
We are hanging and filming the anchor before taking the transect. A tusk (Brosme brosme) has the tail of a shark hanging out its mouth. Ling (Molva molva) and saith (Pollachius virens) also moving around at the anchor site. Hydrozoa, Gastropoda, Asteroidea including Porania pulvillus and Leptasterias muelleri, living on the anchor.
Muddy sand mostly. Area with some gravel on muddy sand in the middle of the transect.
Small sea urchins (Gracilechinus) dominating, with Spatangus purpureus regularly. Various Asteroidea (starfish), Paguridae (hermit crabs), sea cucumber (Parastichopus tremulus), polychaeta (Ditrupa arietina) were also common.
A shoal of saith (Pollachius virens) followed the ROV, stirring up sediment and disturbing the vision.
Ling (Molva molva), tusk (Brosme brosme), blue mouth (Helicolenus dactylopterus), flatfish (Glyptocephalus synoglossus) were some of the fish species recorded.
No core sample.
Moving to HT 05, passing the Hydrophone.
ROV station HT05 (19,03.23 kl 19:20)
Control transect, starting in North West moving South East 500m off the chain towards the suction anchor, SA09.
Muddy sand with some burrows.
Small sea urchins (Gracilechinus sp.) dominating the transect with some Spatangus purpureus here and there. Shoal of saith (Pollachius virens) following and stirring up sediments disturbing the vision. A ling (Molva molva) forage together with saithe.
Along the transect we observe sea cucumber (Parastichopus tremulus), hermit crab (Pagurus sp.), polychaeta (Ditrupa arietina), ray-finned flatfish (Pleuronectiformes ), various Asteroidea, gastropod (Neptunea antigua) and a couple of blue mouth (Helicolenus dactylopterus).
Filming a still sequence at the suction anchor. Many ling (Molva molva) and tusk (Brosme brosme) hiding in the anchor and swimming around it. Hydrozoans growing on the anchor.
Core is taken at anchor site (core sample CHT05).
ROV station HT06 (19.03.23 kl 20:17)
Starting from the suction anchor SA09, continuing South-East on the anchor chain.
Filming the suction anchor. Ling (Molva molva), tusk (Brosme brosme) and saithe (Pollachius virens) swimming around. Muddy sand.
The shoal of saithe (Pollachius virens) following is smaller here compared to last transect off the chain. Sea urchins (Gracilechinus sp. and Spatangus purpureus), sea cucumber (Parastichopus tremulus) and hermit crabs (Pagurus sp.) are common. Forkbeard (Phycis blennoides), hermit crabs (Paguridae), squat lobsters (Munida sp.) living under the chain, Leptasterias sp. and other asteroids living on the chain as well.
Stopping the transect at 447 into the line since chain rises from the sea floor. Not safe for the ROV to move on. No core sample.
ROV station HT07 (19.03.23 kl 21:50)
Control transect in North-East direction 500 m off chain towards suction anchor SA09.
A big Shoal of saithe (Pollachius virens) following ROV, stirring up sediments and disturbing the vision.
Bottom depression in the beginning of the transect. Main sediment type - muddy sand. Some shell fragments, pebbles, lots of burrows. Flat bottom. Not much variety. Small sea urchins (Gracilechinus sp.) dominating.
Fish species observed along the transect; saithe (Pollachius virens), pearlfish (Echiodon drummondi), blue mouth (Helicolenus dactylopterus), greater forkbeard (Phycis blennoides), witch flounder (Glyptocephalus cynoglossus). Sea cucumber (Parastichopus tremulus), shrimp (Caridea), starfish (Asteroidea), polychaeta (Ditrupa arietina), hermit crabs (Paguridae).
Suction anchor at the end of the transect, with ling (Molva molva) around and on the anchor.
No core sample.
ROV station HT08 (19.03.23 kl 22:30)
Transect from suction anchor, SA09, 460 m on chain North-East direction towards Hy10. Transect was stopped where chain rises from the sea floor. We then moved back a few meters, at safe distance from rising chain, for taking a push core (core sample CHT08). Sandy sediments disturbed by whipping chain makes it hard to push down the core, with just a few cm sediments in the core as a result. Muddy sand.
Along the transect, saithe (Pollachius virens) seem to keep a distance to the chain as we go, especially at the first part of the transect. Then foraging more eagerly at the last part.
Life is more diverse and abundant in and on the chain, compared to the transect off the chain, with species of squat lobster (Munida sp.), hermit crab (Pagurus sp.), crab (Brachyura), various Asteroidea, Gastropoda (Prosobranchia) and fishes like ling (Molva molva), greater forkbeard (Phycis blennoides) and tusk (Brosme brosme).
Sea urchin (Gracilechinus sp. and Spatangus purpureus), polychaeta (Ditrupa arietina), sea cucumber (Mesothuria intestinalis and Parastichopus tremulus) and starfish Porania sp. are spotted in the sand. Various flatfish, “vassild” smelt (Argentina silus) and Norway pout (Trisopterus esmarkii) are also recorded.
ROV station HT09 (20.03.23 kl 17:43)
Transect 500 m on chain in South-East direction from anchor SA12. Muddy sand over whole transect. Some shell fragments. Push core CHT09 is taken at the beginning and HT09b at the end of the transect. Core CHT09b - harder sediments, sand mostly. The transect is stopped 470 meters from the suction anchor. Core CHT09b was drained at the surface, not kept – but sediment frozen if later examining is of interest. Fine sand with a small proportion of mud.
“Kolmule” blue whiting (Micromesistius poutassou) was observed before recording was started. (Recorded in backup). Ling (Molva molva) and tusk (Brosme brosme) around suction anchor. “Rur” barnacles (Balanoidea) and Hydroidea are epifauna on anchor. Brittle star (Ophiuroidea) was collected by the ROV manipulator and identified as Ophiura albida later on deck.
Diversity is higher at first half of the transect. A smaller shoal of saithe (Pollachius virens), especially in the beginning. Foraminifera sand amoeba, polychaeta (Ditrupa arietina), crustacean amphipod (Siphonoecetes sp.), bivalve (Astarte sp. and Abra sp.) empty shells. Sea urchin (Gracilechinus sp.) along the whole transect, Spatangus sp., Ophiuroidea sp., Pseudarchaster sp., Pontaster sp. as well as other different Asteroidea species. Fish observed were ling (Molva molva) and tusk (Brosme brosme) from time to time along the whole transect, greater forkbeard (Phycis blennoides), blue mouth (Helicolenus dactylopterus), ray-finned flatfish (Pleuronectiformes sp.), silver cod (Gadiculus argenteus), Norway pout (Trisopterus esmarkii). Hermit crab, (Pagurus sp.), with houses of sponges (Suberites sp.), sea cucumber (Parastichopus tremulus), squat lobster (Munida sp.), gastropod (Colus sp.), shrimp (Caridea), sea anemone (Bolocera tuediae).
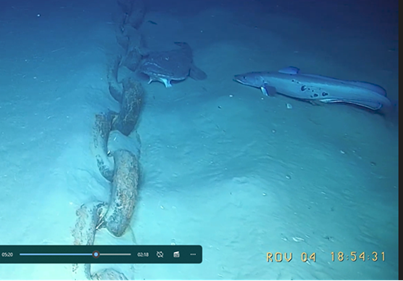
We stopped to film an anglerfish (Lophius sp.) that was lying on the side of the chain, fishing for prey. As well as a long, fish / dolphin skeleton.
ROV station HT10 (20.03.23 kl 20:02)
Control transect starting from suction anchor going North-West for 500 meters off the chain.
Ling (Molva molva) and tusk (Brosme brosme) close to anchor, outnumbered by saithe (Pollachius virens) as we start moving. A big shoal of saithe following throughout the transect, stirring up the sediments.
Sea urchins (Gracilechinus sp)., polychaeta (Ditrupa arietina) and brittle stars (Ophiuroidea) dominating, with sea urchin (Spatangus sp.), sea cucumber (Parastichopus tremulus), hermit crabs (Paguridae), shrimps, gastropods and various Ateroidea less abundant.
Flounder (Glyptocephalus cynoglossus), smelt (Argentina sp.) and ling (Molva molva) also along the transect. Dogfish (Galeus melastomus) was close to being eaten by saithe.
Taking a core in North-West, 500 meters away from suction anchor SA12 (corer sample CHT10).
ROV station HT11 (20.03.23 kl 22:08)
Control transect, starting in South-West, going 500 meters towards suction anchor SA12, North East direction off chain. Muddy sand with some shell fragments and burrows.
Shoal of saithe (Pollachius virens) messing the sediments swimming in front of the ROV. Ling (Molva molva), tusk (Brosme brosme), sea urchin (Spatangus sp. and Gracilechinus sp.), different starfish (Asteroidea), brittle stars (Ophiuroidea), polychaeta (Ditrupa arietina), shrimp (Caridea) and sea cucumber (Parastichopus tremulus). Poor diversity transect.
ROV station HT12 (20.03.23 kl 22:44)
Starting from suction anchor SA12 going North-East for 442 meters on chain, till the chain were rising from the sea floor.
Saithe (Pollachius virens) slowly get fewer and disappear along the chain. Dense aggregation of ling (Molva molva) in the middle of transect, where many of them lay under, on the side or inside the chain.
Trace of something under sediments with tracks around it - old trawl mark or traces from chain.
Sea urchin (Gracilechinus sp.) and various starfish (Asteroidea) very common both in the sediments and on the chain. “Rur” barnacles (Balanoidea) growing on the chain. Hermit crabs (Paguridae), squat lobster (Munida sp.), sea cucumber (Parastichopus tremulus) and shrimps (Caridea) common.
Inside the safety zone, 500m from the turbine, whipping marks from the chain get stronger and epibenthos less abundant. Transect stopped where the chain rises from the bottom. Various litter.
Total area
It appears to be sandier sediments in the south compared to northern anchor – not confirmed. Several sea cucumbers ( Parastichopus tremulus ) in the area were seen in bad condition, partly colored black. Many l ing ( Mova molva ) were also observed with black spots ( Figure 22 ). Next time we need to take tissue samples from these ling to find out what it is.
Core samples
I addition to the transects ten Push core samples were taken during the inspection of the anchors and chains.
Table 6. Push Core samples taken during the 12 ROV transects. No core was taken on transect HT04, HT06 or HT07. Two corers were taken on HT09 (CHT09a and CHT09b). For positions are given in the campodlogger.
|
Core on transect # |
Core sample # |
Saple location |
|---|---|---|
|
HT01 |
CHT01 |
at suction anchor SA6 |
|
HT02 |
CHT02 |
375m north-east of SA06 on chain |
|
HT03 |
CHT03 |
500m north-west of SA06 off chain |
|
HT05 |
CHT05 |
at suction anchor SA09 |
|
HT08 |
CHT08 |
460 m north-east of SA09 on chain |
|
HY09 |
CHT09a |
suction anchor SA12 |
|
HY09 |
CHT09b |
470m south-east of SA12 on chain – drained, some sediments frozen in alu. foil |
|
HT10 |
CHT10 |
500m north-west of SA12 off chain |
3.5 eDNA
A simple way of sampling what animals are present in an area is by extracting eDNA from water samples. First, we sampled the location of the 7 gillnet stations from the fisheries survey cruise conducted in March 2022 and 2023 ( Figure 11 ). Sampling locations were a bit north of the gillnet fishing locations, but at the same distance to the windfarm (0.27, 0.54, 1.08, 2.27, 5.4, 10.8 and 18.9 nm from turbines in a South-West direction to the U.K. border).
From each station, we sampled 2x 5 litre water from three depths: surface, pycnocline and bottom. Depth of the surface sample ca. 10 m, bottom sample ca. 10 m above the bottom. Before sampling water, we took a CTD haul to find the pycnocline. In total for the fisheries transect we took 42 samples (7 stations 6 samples).
In between every station we took a air control sample (control). Air control sample was done by pumping just the air after sampling, and pumping some of the fresh water that is used to flush the buckets.
Further we sampled eDNA at the 15 CTD stations in the acoustic flower transect around the windfarm ( Figure 15 ). Here we took only eDNA at the pycnocline, to save some samples. While for the three CTD stations inside the park ( Figure 13 ), we took eDNA et surface pycnocline and at 30 m above bottom. Due to windfarm structure on the bottom we were not allowed to sample closer than 30 m to the seafloor.
Acknowledgement
This cruise was conducted in collaboration with the NFR-funded project WindSys and the project partners within that project. We would like to particularly thank Equinor for the close collaboration during the cruise planning and during the measurements in and around Hywind Tampen.
4 References
Burkhard B, Opitz S, Lenhart H, Ahrendt K, Garthe S, Mendel B, et al. (2011). Ecosystem based modeling and indication of ecological integrity in the German North Sea—case study offshore wind parks. Ecol. Indic. 11, 168–174. https://doi.org/10.1016/J.ECOLIND.2009.07.004
Burns RDJ, SB Martin, MA Wood, CC Wilson, CE Lumsden and F Pace (2022). Hywind Scotland Floating Offshore Wind Farm: Sound Source Characterisation of Operational Floating Turbines. Document 02521, Version 3.0 FINAL. Technical report by JASCO Applied Sciences for Equinor Energy AS.
Christiansen N, Daewel U, Djath B and C Schrum (2022) Emergence of Large-Scale Hydrodynamic Structures Due to Atmospheric Offshore Wind Farm Wakes. Front. Mar. Sci. 9:818501. https://doi:10.3389/fmars.2022.81850
Duarte CM, Chapuis L, Collin SP, Costa DP, et al. 2021. The soundscape of the Anthropocene ocean. Science 371 (6529), eaba4658. DOI: 10.1126/science.aba4658.
Daewel U, N Akhtar, N Christiansen and C Schrum (2022). Offshore wind farms are projected to impactprimary production and bottom water deoxygenation in the North Sea. Communication Earth & Environment 3:29.2. https://doi.org/10.1038/s43247-022-00625-0
Floeter J, Pohlmann T, Harmer A and C Möllmann (2022.) Chasing the offshore wind farm wind-wake-induced upwelling/downwelling dipole. Front. Mar. Sci. 9:884943. https://doi:10.3389/fmars.2022.884943
de Jong, K., McQueen, K., Hareide, N.R., Tenningen, M., Macaulay, G., Majaneva, M.A. 2022. Fisheries survey in the offshore wind power field Hywind Tampen before development. Cruise report 2022-15 Institute of Marine Research, Toktrapport 2022-15. https://www.hi.no/hi/nettrapporter/toktrapport-en-2022-15
Lindeboom, HJ, Kouwenhoven HJ, Bergman MJN, Bouma S, Brasseur S, Daan R, et al. (2011). Short-term ecological effects of an offshore wind farm in the. Dutch coastal zone; a compilation. Environ. Res. Lett. 6, 35101. https://doi.org/10.1088/1748-9326/6/3/035101.
Løkkeborg S, Humborstad O-B, Jørgensen T, Vold Soldal A 2002. Spatio-temporal variations in gillnet catch rates in the vicinity of North Sea oil platforms. ICES Journal of Marine Science, Volume 59, Issue suppl, 2002, Pages S294–S299, https://doi.org/10.1006/jmsc.2002.1218
Methratta ET, Dardickc WR 2019. Meta-Analysis of Finfish Abundance at Offshore Wind Farms. Reviews in Fisheries Science & Aquaculture. 27(2):242–260 https://doi.org/10.1080/23308249.2019.1584601
Report from Equinor. Hywind Tampen PL050 - PL057 - PL089 PUD del II - Konsekvensutredning Mars 2019. https://cdn.equinor.com/files/h61q9gi9/global/59db109a1ab7991e6b7546ef9b161dcfa74ec514.pdf?hywind-tampen-pud-del-II-konsekvensutredning-mars-2019-equinor.pdf
Totland A. and E. Johnsen 2022. Frontiers in Marine Science 9: Kayak Drone – a silent acoustic unmanned surface vehicle for marine research. https://doi.org/10.3389/fmars.2022.986752
Tougaard J, Hermannsen L and PT Madsen (2020). How loud is the underwater noise from operating offshore wind turbines? The Journal of the Acoustical Society of America 148, 2885. https://doi.org/10.1121/10.0002453
Vold Soldal A, Svellingen I, Jørgensen T, Løkkeborg S 2002. Rigs-to-reefs in the North Sea: hydroacoustic quantification of fish in the vicinity of a “semi-cold” platform. ICES Journal of Marine Science, Volume 59, Issue suppl, 2002, Pages S281–S287, https://doi.org/10.1006/jmsc.2002.1279
Wang T, Ru X, Deng B, Zhanga C, Wanga X, Yang B, Zhang L (2023). Evidence that offshore wind farms might affect marine sediment quality and microbial communities. Science of the Total Environment 856 (2023) 158782
5 Abbreviation and word explanation
ADCP: is an Acoustic Doppler Current Profiler. It is a hydroacoustic current meter similar to a sonar, used to measure water current velocities over a depth range using the Doppler effect of sound waves scattered back from particles within the water column.
Acoustic releaser: is for the deployment and subsequent recovery of instrumentation from the sea floor, in which the recovery is triggered remotely by an acoustic command signal.
CTD: is an oceanography instrument used to measure the electrical conductivity, temperature, and pressure of seawater. Conductivity is used to determine salinity and depth is calculated from pressure.
eDNA or Environmental DNA is DNA that is collected from a variety of environmental samples such as soil, seawater, snow or air, rather than directly sampled from an individual organism. As various organisms interact with the environment, DNA is expelled and accumulates in their surroundings.
Hydrophone: is a microphone designed to be used underwater for recording or listening to underwater sound. Most hydrophones are based on a piezoelectric transducer that generates an electric potential when subjected to a pressure change, such as a sound wave.
LSSS: Large Scale Survey System (LSSS) (pronounced "L-triple-S"). A software product for the interpretation of data from multi-frequency echo sounders. For more details see: https://www.kongsberg.com/maritime/products/ocean-science/ocean-science/scientific-post-processing-applications/large-scale-survey-system-lsss/
Multi-frequency echosounder: Recent research has shown that simultaneous use of several discrete echo sounder frequencies (multifrequency) not only improves fish stock estimates but can also be used to identify species. This is because each specie has a unique acoustic frequency response. This new and growing understanding greatly improves the value of hydroacoustics to obtain information about marine resources. For more information see: https://www.kongsberg.com/maritime/support/themes/simrad-content-s/scientific-applications/multifrequency-echo-sounder-operation/
ROV: stands for remote operating vehicle. ROVs are unmanned, highly manoeuvrable underwater machines that can be used to explore ocean depths while being operated by someone at the water surface. For more details see: https://www.revocean.org/vessel/rov/
DeepVision: is a camera system that is mounted at the cod-end entrance of the trawl. Here it takes pictures of the catch as it passes through the trawl. It is used to sample fish without having to land or injure the fish, as the fish passes through the open trawl cod-end. For more details see: https://www.deepvision.no/deep-vision-for-marine-research
6 Appendix
|
Station type |
Date |
Time (UCT) |
St.No |
Latitude |
Longitude |
Depth (m) |
Speed |
Water temp |
Wind (m/s) |
Wind dir |
Air temp |
|---|---|---|---|---|---|---|---|---|---|---|---|
|
Pelagic trawl start - test |
14.mar |
12:17:32 |
51 |
6038.390271 N |
00453.062923 E |
219,16 |
2,8 |
6,6 |
|
|
0,2 |
|
Pelagic trawl stop - test |
14.mar |
12:24:43 |
51 |
6038.675625 N |
00452.684602 E |
171,79 |
3 |
6,7 |
10,4 |
334 |
0,1 |
|
ADCP2 |
14.mar |
23:59:39 |
8 |
6115.384594 N |
00217.350361 E |
255,41 |
0,1 |
6,9 |
4,7 |
60 |
3,3 |
|
ADCP3 |
15.mar |
01:26:53 |
9 |
6123.367720 N |
00220.045226 E |
317,21 |
0,3 |
6,5 |
5,9 |
67 |
3,2 |
|
ADCP5 |
15.mar |
02:37:13 |
10 |
6122.133859 N |
00210.887600 E |
289,66 |
0 |
6,5 |
10 |
67 |
3,7 |
|
ADCP4 |
15.mar |
03:55:06 |
11 |
6120.734480 N |
00213.610215 E |
288,42 |
0 |
6,5 |
8,4 |
67 |
4 |
|
Hydrophone |
15.mar |
06:28:27 |
12 |
6120.559786 N |
00213.665359 E |
286,31 |
0,1 |
6,5 |
5,7 |
55 |
4,6 |
|
ADCP1 |
15.mar |
09:02:00 |
13 |
6120.788888 N |
00215.610641 E |
292,52 |
0 |
6,5 |
3,4 |
87 |
4,7 |
|
CTD start (to get desity measures for acoustic contact (HIPAP)) |
15.mar |
13:01:53 |
175 |
6120.837544 N |
00213.902110 E |
288,51 |
0 |
6,7 |
5,4 |
60 |
4,7 |
|
CTD stop |
15.mar |
13:14:03 |
175 |
6120.836933 N |
00213.901548 E |
288,71 |
0,1 |
6,7 |
5,4 |
74 |
4,7 |
|
ROV SA06 chain mot HY11 station start |
15.mar |
15:14:37 |
1 |
6120.961592 N |
00213.652568 E |
287,49 |
0 |
6,7 |
5,8 |
89 |
4,5 |
|
ROV SA06 chain mot HY11 station stop |
15.mar |
16:27:48 |
1 |
6120.832271 N |
00213.880689 E |
289,15 |
0,1 |
6,8 |
6,7 |
119 |
5 |
|
ROV SA06 chain mot HY10 station start |
15.mar |
17:27:12 |
2 |
6120.954294 N |
00213.615696 E |
289,67 |
0,1 |
6,8 |
|
|
4,8 |
|
ROV SA06 chain mot HY10 station stop |
15.mar |
18:09:26 |
2 |
6121.137264 N |
00213.712688 E |
289,81 |
0 |
6,8 |
9,5 |
132 |
4,9 |
|
CTD fisheries transect eDNA with watersample start |
17.mar |
19:58:28 |
176 |
6108.118027 N |
00151.703662 E |
141,89 |
0,3 |
7,9 |
10,7 |
6 |
5,3 |
|
CTD fisheries transect eDNA with watersample stop |
17.mar |
20:15:27 |
176 |
6108.118308 N |
00151.705917 E |
141,97 |
0 |
7,9 |
11,2 |
6 |
4,9 |
|
CTD fisheries transect nutrients with watersample start |
17.mar |
20:15:59 |
177 |
6108.119281 N |
00151.705251 E |
142,17 |
0,1 |
7,9 |
12 |
10 |
4,8 |
|
CTD fisheries transect nutrients with watersample stop |
17.mar |
20:23:15 |
177 |
6108.119938 N |
00151.706716 E |
142,11 |
0,1 |
7,9 |
10,1 |
1 |
4,9 |
|
Course change |
17.mar |
20:50:10 |
14 |
6111.109933 N |
00149.573986 E |
146 |
6,7 |
8,1 |
7,5 |
10 |
4,6 |
|
Course change |
17.mar |
21:19:19 |
15 |
6113.794628 N |
00156.147007 E |
144,9 |
8 |
8,2 |
11 |
9 |
5,1 |
|
CTD fisheries transect eDNA with watersample start |
17.mar |
22:27:25 |
178 |
6112.054326 N |
00159.364024 E |
142,47 |
0 |
8,1 |
6,8 |
1 |
4,9 |
|
CTD fisheries transect eDNA with watersample stop |
17.mar |
22:36:59 |
178 |
6112.054064 N |
00159.365539 E |
142,58 |
0 |
8,1 |
7,8 |
357 |
5 |
|
CTD fisheries transect nutrients with watersample start |
17.mar |
22:42:51 |
179 |
6112.052574 N |
00159.366970 E |
142,87 |
0,2 |
8,1 |
7,2 |
360 |
5 |
|
CTD fisheries transect nutrients with watersample stop |
17.mar |
22:50:08 |
179 |
6112.054332 N |
00159.364997 E |
142,37 |
0 |
8,1 |
8,2 |
360 |
5,1 |
|
Course change |
17.mar |
23:20:04 |
16 |
6113.804285 N |
00156.161666 E |
144,62 |
5,2 |
8,3 |
7,7 |
5 |
5,1 |
|
Course change |
18.mar |
00:01:37 |
17 |
6115.803830 N |
00200.897931 E |
142,45 |
4,3 |
7,8 |
7,7 |
10 |
4,9 |
|
CTD fisheries transect eDNA with watersample start |
18.mar |
00:32:28 |
180 |
6113.987372 N |
00203.139694 E |
139,82 |
0 |
8,3 |
9,7 |
17 |
4,9 |
|
CTD fisheries transect eDNA with watersample stop |
18.mar |
00:40:58 |
180 |
6113.987273 N |
00203.139979 E |
140,23 |
0 |
8,3 |
8,6 |
5 |
5 |
|
CTD fisheries transect nutrients with watersample start |
18.mar |
00:48:28 |
181 |
6113.995137 N |
00203.176828 E |
140,55 |
0,1 |
8,2 |
7,7 |
22 |
5 |
|
CTD fisheries transect nutrients with watersample stop |
18.mar |
00:56:20 |
181 |
6113.995978 N |
00203.177807 E |
139,91 |
0,1 |
8,3 |
7 |
10 |
5 |
|
Course change |
18.mar |
01:25:03 |
18 |
6115.775937 N |
00200.845707 E |
142,18 |
3,1 |
7,8 |
9,8 |
13 |
4,6 |
|
Course change |
18.mar |
02:13:53 |
19 |
6119.043006 N |
00208.700660 E |
256,24 |
7,2 |
7,2 |
9,5 |
22 |
4,7 |
|
CTD fisheries transect eDNA with watersample start |
18.mar |
02:35:02 |
182 |
6117.907580 N |
00210.877270 E |
252,49 |
0 |
7,2 |
8,1 |
22 |
4,6 |
|
CTD fisheries transect eDNA with watersample stop |
18.mar |
02:47:08 |
182 |
6117.907995 N |
00210.876245 E |
253,47 |
0,1 |
7,1 |
7 |
19 |
4,7 |
|
CTD fisheries transect nutrients with watersample start |
18.mar |
02:55:18 |
183 |
6117.906673 N |
00210.877657 E |
252,49 |
0 |
7,1 |
8,5 |
23 |
4,7 |
|
CTD fisheries transect nutrients with watersample stop |
18.mar |
03:06:45 |
183 |
6117.908910 N |
00210.878116 E |
253,06 |
0 |
7,1 |
5,6 |
22 |
4,8 |
|
Course change |
18.mar |
03:22:27 |
20 |
6119.037658 N |
00208.608589 E |
257,37 |
4,8 |
7,2 |
7,9 |
28 |
4,8 |
|
Course change |
18.mar |
03:36:45 |
21 |
6120.132640 N |
00211.292464 E |
281,58 |
7,6 |
7,2 |
7,2 |
19 |
4,7 |
|
CTD fisheries transect eDNA with watersample start |
18.mar |
04:00:18 |
184 |
6119.070333 N |
00213.199505 E |
278,02 |
0,2 |
6,9 |
8,3 |
21 |
4,7 |
|
CTD fisheries transect eDNA with watersample stop |
18.mar |
04:14:03 |
184 |
6119.070709 N |
00213.200761 E |
277,61 |
0,2 |
6,9 |
9,7 |
29 |
4,7 |
|
CTD fisheries transect nutrients with watersample start |
18.mar |
04:24:55 |
185 |
6119.070351 N |
00213.200284 E |
277,49 |
0,1 |
6,9 |
6,9 |
33 |
4,7 |
|
CTD fisheries transect nutrients with watersample stop |
18.mar |
04:36:31 |
185 |
6119.069946 N |
00213.199586 E |
277,33 |
0,1 |
6,9 |
7,1 |
26 |
4,5 |
|
CTD fisheries transect eDNA with watersample start |
18.mar |
05:11:21 |
186 |
6119.456174 N |
00213.975773 E |
281,23 |
0 |
7 |
8,7 |
31 |
4,7 |
|
CTD fisheries transect eDNA with watersample stop |
18.mar |
05:23:56 |
186 |
6119.456634 N |
00213.974355 E |
280,66 |
0,1 |
7 |
9,8 |
55 |
4,7 |
|
CTD fisheries transect nutrients with watersample start |
18.mar |
05:34:07 |
187 |
6119.456058 N |
00213.975964 E |
280,89 |
0 |
7 |
6,6 |
55 |
4,7 |
|
CTD fisheries transect nutrients with watersample stop |
18.mar |
05:45:49 |
187 |
6119.456673 N |
00213.975967 E |
281,32 |
0 |
7 |
7,4 |
59 |
4,7 |
|
CTD fisheries transect eDNA with watersample start |
18.mar |
06:21:37 |
188 |
6119.634717 N |
00214.336195 E |
283,97 |
0 |
6,8 |
8,5 |
40 |
4,8 |
|
CTD fisheries transect eDNA with watersample stop |
18.mar |
06:34:15 |
188 |
6119.634552 N |
00214.334925 E |
283,59 |
0 |
6,8 |
8,8 |
53 |
4,8 |
|
CTD fisheries transect nutrients with watersample start |
18.mar |
07:22:39 |
189 |
6119.634913 N |
00214.335148 E |
283,72 |
0,1 |
6,8 |
9,5 |
45 |
4,8 |
|
CTD fisheries transect nutrients with watersample stop |
18.mar |
07:35:35 |
189 |
6119.633954 N |
00214.335273 E |
283,41 |
0,1 |
6,8 |
9,9 |
44 |
4,9 |
|
Course change |
18.mar |
09:11:56 |
22 |
6121.275744 N |
00212.016649 E |
287,9 |
7,5 |
6,9 |
8,4 |
59 |
5,9 |
|
Pelagic trawl start - flower |
18.mar |
11:00:22 |
52 |
6118.906938 N |
00209.461550 E |
257,9 |
2,8 |
7,1 |
9,6 |
60 |
4,9 |
|
Pelagic trawl stop - flower |
18.mar |
11:15:41 |
52 |
6118.468899 N |
00210.531427 E |
259,8 |
2,7 |
7,2 |
|
|
4,9 |
|
Pelagic trawl start - flower |
18.mar |
12:46:14 |
53 |
6118.856754 N |
00210.853541 E |
264,36 |
2,7 |
7,2 |
6,7 |
64 |
5 |
|
Pelagic trawl stop - flower |
18.mar |
13:03:16 |
53 |
6118.140940 N |
00211.248739 E |
257,83 |
2,1 |
7,3 |
6,5 |
57 |
4,9 |
|
Pelagic trawl start - flower |
18.mar |
14:47:06 |
54 |
6118.547661 N |
00210.852752 E |
260,63 |
2,2 |
7,3 |
8,6 |
55 |
5 |
|
Pelagic trawl stop - flower |
18.mar |
15:02:09 |
54 |
6117.934260 N |
00211.049154 E |
253,14 |
2,4 |
7,4 |
7 |
60 |
4,9 |
|
Pelagic trawl start - flower |
18.mar |
17:53:15 |
55 |
6115.504060 N |
00219.667006 E |
265,43 |
2,6 |
7,4 |
11,8 |
56 |
5 |
|
Pelagic trawl stop - flower |
18.mar |
18:08:19 |
55 |
6114.970377 N |
00220.485965 E |
265,45 |
2,6 |
7,4 |
10,7 |
49 |
5 |
|
CTD eDNA transekt HY06 with watersample start |
18.mar |
20:18:57 |
190 |
6114.772582 N |
00226.166298 E |
281,82 |
0,6 |
6,9 |
9,4 |
72 |
4,8 |
|
CTD eDNA transekt HY06 with watersample stop |
18.mar |
20:29:43 |
190 |
6114.774618 N |
00226.175016 E |
281,74 |
0 |
6,9 |
7,2 |
80 |
4,8 |
|
CTD nutrient transekt HY06 with watersample start |
18.mar |
20:32:50 |
191 |
6114.774381 N |
00226.175745 E |
281,9 |
0 |
6,9 |
7,4 |
82 |
4,9 |
|
CTD nutrient transekt HY06 with watersample stop |
18.mar |
20:44:26 |
191 |
6114.774863 N |
00226.176016 E |
282,01 |
0 |
6,9 |
6,7 |
77 |
4,8 |
|
CTD eDNA transekt HY06 with watersample start |
18.mar |
21:15:14 |
192 |
6116.458066 N |
00221.675233 E |
280,01 |
0,1 |
7,1 |
5,6 |
84 |
4,9 |
|
CTD eDNA transekt HY06 with watersample stop |
18.mar |
21:22:53 |
192 |
6116.459365 N |
00221.674389 E |
279,72 |
0 |
7,1 |
6,2 |
96 |
5 |
|
CTD nutrient transekt HY06 with watersample start |
18.mar |
21:28:48 |
193 |
6116.459778 N |
00221.674130 E |
280,03 |
0,1 |
7,1 |
5,8 |
95 |
4,9 |
|
CTD nutrient transekt HY06 with watersample stop |
18.mar |
21:40:47 |
193 |
6116.458926 N |
00221.674133 E |
279,96 |
0 |
7,1 |
5,7 |
88 |
5 |
|
CTD eDNA transekt HY06 with watersample start |
18.mar |
22:05:36 |
194 |
6117.411652 N |
00219.030206 E |
281,3 |
0 |
7,1 |
5,9 |
105 |
5,1 |
|
CTD eDNA transekt HY06 with watersample stop |
18.mar |
22:13:17 |
194 |
6117.420981 N |
00219.025799 E |
281,56 |
0 |
7,1 |
7 |
98 |
5 |
|
CTD nutrient transekt HY06 with watersample start |
18.mar |
22:18:04 |
195 |
6117.421407 N |
00219.025900 E |
281,59 |
0,1 |
7,1 |
6,2 |
100 |
5 |
|
CTD nutrient transekt HY06 with watersample stop |
18.mar |
22:29:08 |
195 |
6117.421189 N |
00219.026631 E |
281,63 |
0,1 |
7,1 |
5,5 |
113 |
5,1 |
|
CTD eDNA transekt HY06 with watersample start |
18.mar |
22:53:57 |
196 |
6117.686116 N |
00218.029564 E |
278,76 |
0,9 |
7,1 |
6,2 |
115 |
5,1 |
|
CTD eDNA transekt HY06 with watersample stop |
18.mar |
23:02:01 |
196 |
6117.690517 N |
00218.013505 E |
278,85 |
0 |
7,1 |
6,7 |
97 |
5,1 |
|
CTD nutrient transekt HY06 with watersample start |
18.mar |
23:06:36 |
197 |
6117.690453 N |
00218.014096 E |
279,02 |
0 |
7,1 |
7 |
112 |
5,2 |
|
CTD nutrient transekt HY06 with watersample stop |
18.mar |
23:18:03 |
197 |
6117.690364 N |
00218.014236 E |
278,81 |
0 |
7,1 |
6,8 |
92 |
5,3 |
|
CTD eDNA transekt HY06 with watersample start |
18.mar |
23:30:07 |
198 |
6117.787120 N |
00217.662765 E |
280,71 |
0 |
7,2 |
7 |
110 |
5,3 |
|
CTD eDNA transekt HY06 with watersample stop |
18.mar |
23:38:03 |
198 |
6117.787010 N |
00217.665903 E |
280,51 |
0,1 |
7,2 |
7,7 |
115 |
5,3 |
|
CTD nutrient transekt HY06 with watersample start |
18.mar |
23:45:19 |
199 |
6117.786357 N |
00217.665589 E |
280,46 |
0 |
7,2 |
7,5 |
112 |
5,3 |
|
CTD nutrient transekt HY06 with watersample stop |
18.mar |
23:57:00 |
199 |
6117.786752 N |
00217.665160 E |
280,49 |
0 |
7,2 |
6,5 |
116 |
5,4 |
|
CTD eDNA transekt HY04 with watersample start |
19.mar |
00:55:10 |
200 |
6121.358036 N |
00227.243917 E |
326,51 |
0 |
6,8 |
8,9 |
144 |
5,7 |
|
CTD eDNA transekt HY04 with watersample stop |
19.mar |
01:03:30 |
200 |
6121.358509 N |
00227.242566 E |
326,42 |
0 |
6,8 |
7,5 |
139 |
5,8 |
|
CTD nutrient transekt HY04 with watersample start |
19.mar |
01:08:02 |
201 |
6121.357606 N |
00227.240737 E |
326,13 |
0 |
6,8 |
|
|
5,8 |
|
CTD nutrient transekt HY04 with watersample stop |
19.mar |
01:20:31 |
201 |
6121.358361 N |
00227.241945 E |
326,24 |
0,1 |
6,8 |
|
|
5,9 |
|
CTD eDNA transekt HY04 with watersample start |
19.mar |
01:48:45 |
202 |
6120.736172 N |
00222.166181 E |
307,2 |
0 |
6,6 |
8,4 |
141 |
6 |
|
CTD eDNA transekt HY04 with watersample stop |
19.mar |
01:58:23 |
202 |
6120.736231 N |
00222.167706 E |
307,03 |
0 |
6,6 |
8,6 |
141 |
5,9 |
|
CTD nutrient transekt HY04 with watersample start |
19.mar |
02:09:08 |
203 |
6120.736784 N |
00222.168372 E |
307,46 |
0 |
6,6 |
8,9 |
150 |
5,9 |
|
CTD nutrient transekt HY04 with watersample stop |
19.mar |
02:21:20 |
203 |
6120.736758 N |
00222.167760 E |
307,44 |
0 |
6,6 |
8,2 |
143 |
5,9 |
|
CTD eDNA transekt HY04 with watersample start |
19.mar |
02:47:05 |
204 |
6120.284935 N |
00218.608727 E |
295,65 |
0,1 |
6,7 |
11,1 |
148 |
6,2 |
|
CTD eDNA transekt HY04 with watersample stop |
19.mar |
02:56:48 |
204 |
6120.286651 N |
00218.608489 E |
295,89 |
0 |
6,7 |
13 |
155 |
6,3 |
|
CTD nutrient transekt HY04 with watersample start |
19.mar |
03:05:12 |
205 |
6120.286450 N |
00218.609403 E |
295,89 |
0 |
6,8 |
11,8 |
160 |
6,4 |
|
CTD nutrient transekt HY04 with watersample stop |
19.mar |
03:17:04 |
205 |
6120.285928 N |
00218.607672 E |
295,93 |
0 |
6,8 |
10,8 |
152 |
6,5 |
|
CTD eDNA transekt HY04 with watersample start |
19.mar |
03:35:05 |
206 |
6120.141183 N |
00217.558965 E |
293,84 |
0 |
6,9 |
13,5 |
169 |
6,8 |
|
CTD eDNA transekt HY04 with watersample stop |
19.mar |
03:47:22 |
206 |
6120.142023 N |
00217.562051 E |
293,74 |
0 |
7 |
|
|
6,7 |
|
CTD nutrient transekt HY04 with watersample start |
19.mar |
04:04:39 |
207 |
6120.141869 N |
00217.562359 E |
293,9 |
0 |
7 |
12,8 |
178 |
6,7 |
|
CTD nutrient transekt HY04 with watersample stop |
19.mar |
04:28:06 |
207 |
6120.141522 N |
00217.562769 E |
294,1 |
0 |
7,1 |
12,7 |
173 |
6,8 |
|
CTD eDNA transekt HY04 with watersample start |
19.mar |
04:43:52 |
208 |
6120.096329 N |
00217.152542 E |
291,99 |
0,1 |
7,1 |
12,8 |
183 |
7,1 |
|
CTD eDNA transekt HY04 with watersample stop |
19.mar |
04:57:31 |
208 |
6120.096017 N |
00217.152632 E |
292,16 |
0 |
7,1 |
13,4 |
190 |
7,3 |
|
CTD nutrient transekt HY04 with watersample start |
19.mar |
05:02:46 |
209 |
6120.096487 N |
00217.153955 E |
292,32 |
0,1 |
7,1 |
12,3 |
187 |
7,4 |
|
CTD nutrient transekt HY04 with watersample stop |
19.mar |
05:15:57 |
209 |
6120.095331 N |
00217.152178 E |
292,29 |
0 |
7,1 |
13,5 |
190 |
7,5 |
|
CTD eDNA transekt HY01 with watersample start |
19.mar |
06:19:36 |
210 |
6125.423404 N |
00206.407180 E |
300,17 |
0,3 |
7,3 |
12,1 |
229 |
7,6 |
|
CTD eDNA transekt HY01 with watersample stop |
19.mar |
06:33:35 |
210 |
6125.411734 N |
00206.446979 E |
299,86 |
0 |
7,4 |
13,5 |
226 |
7,6 |
|
CTD nutrient transekt HY01 with watersample start |
19.mar |
06:56:00 |
211 |
6125.412247 N |
00206.446967 E |
300,32 |
0,1 |
7,4 |
7,3 |
345 |
5,2 |
|
CTD nutrient transekt HY01 with watersample stop |
19.mar |
07:09:24 |
211 |
6125.412152 N |
00206.446835 E |
300,08 |
0,3 |
7,4 |
7,5 |
343 |
4,5 |
|
CTD eDNA transekt HY01 with watersample start |
19.mar |
07:36:53 |
212 |
6123.792009 N |
00210.876908 E |
299,12 |
0,1 |
7,4 |
5,9 |
343 |
4,7 |
|
CTD eDNA transekt HY01 with watersample stop |
19.mar |
07:54:07 |
212 |
6123.789064 N |
00210.873266 E |
298,99 |
0,1 |
7,4 |
6,8 |
329 |
4,6 |
|
CTD nutrient transekt HY01 with watersample start |
19.mar |
07:57:11 |
213 |
6123.789359 N |
00210.874215 E |
298,89 |
0,1 |
7,4 |
|
|
4,4 |
|
CTD nutrient transekt HY01 with watersample stop |
19.mar |
08:10:05 |
213 |
6123.789637 N |
00210.873772 E |
298,75 |
0 |
7,4 |
6,9 |
340 |
4,3 |
|
CTD eDNA transekt HY01 with watersample start |
19.mar |
08:32:18 |
214 |
6122.709570 N |
00213.386165 E |
298,19 |
1,1 |
7,2 |
8,3 |
327 |
4,1 |
|
CTD eDNA transekt HY01 with watersample stop |
19.mar |
08:48:41 |
214 |
6122.725546 N |
00213.388127 E |
297,83 |
0,1 |
7,2 |
7,5 |
328 |
4,2 |
|
CTD nutrient transekt HY01 with watersample start |
19.mar |
08:54:42 |
215 |
6122.726902 N |
00213.387481 E |
297,64 |
0 |
7,3 |
|
|
4,3 |
|
CTD nutrient transekt HY01 with watersample stop |
19.mar |
09:07:11 |
215 |
6122.726895 N |
00213.387748 E |
297,71 |
0 |
7,3 |
8,2 |
322 |
4,2 |
|
CTD eDNA transekt HY01 with watersample start |
19.mar |
09:25:00 |
216 |
6122.357774 N |
00214.177957 E |
298,25 |
0 |
7,2 |
7,8 |
309 |
4,4 |
|
CTD eDNA transekt HY01 with watersample stop |
19.mar |
09:38:33 |
216 |
6122.358371 N |
00214.177279 E |
298,27 |
0 |
7,2 |
9,2 |
311 |
4,4 |
|
CTD nutrient transekt HY01 with watersample start |
19.mar |
09:53:56 |
217 |
6122.357041 N |
00214.174663 E |
297,98 |
0 |
7,2 |
8,2 |
326 |
4,3 |
|
CTD nutrient transekt HY01 with watersample stop |
19.mar |
09:54:09 |
217 |
6122.357650 N |
00214.174778 E |
298,51 |
0,1 |
7,2 |
7,9 |
324 |
4,3 |
|
Course change back on acoustic transect flower |
19.mar |
10:32:33 |
23 |
6118.071546 N |
00218.240264 E |
282,8 |
4,2 |
7,3 |
10 |
313 |
4,6 |
|
Course change |
19.mar |
11:14:36 |
24 |
6120.821556 N |
00227.485968 E |
323,16 |
9,4 |
6,8 |
9,1 |
319 |
5 |
|
Course change |
19.mar |
11:20:00 |
25 |
6121.298947 N |
00226.718078 E |
324,81 |
8,8 |
6,8 |
8,7 |
321 |
4,9 |
|
Pelagic trawl start - flower |
19.mar |
11:56:59 |
56 |
6120.909273 N |
00223.997634 E |
313,55 |
2,8 |
6,9 |
7 |
330 |
5 |
|
Pelagic trawl stop - flower |
19.mar |
12:38:01 |
56 |
6121.273166 N |
00227.566465 E |
326,6 |
2,6 |
6,7 |
7,2 |
317 |
5 |
|
Course change - back on acoustic transect flower |
19.mar |
13:32:47 |
26 |
6120.150881 N |
00217.270135 E |
290,84 |
9,8 |
7,2 |
6,3 |
335 |
5,2 |
|
ROV SA06 control station start |
19.mar |
15:11:11 |
3 |
6120.952299 N |
00213.626023 E |
288,93 |
0 |
7,2 |
6,5 |
305 |
5,3 |
|
ROV SA06 controstation stop |
19.mar |
16:12:12 |
3 |
6121.142792 N |
00213.229794 E |
289,88 |
0 |
7,2 |
|
|
5,2 |
|
ROV SA06 contro station start |
19.mar |
17:27:32 |
4 |
6120.949281 N |
00213.632020 E |
304,25 |
0,1 |
7,2 |
2,2 |
303 |
4,8 |
|
ROV SA06 contro station stop |
19.mar |
18:20:10 |
4 |
6120.693089 N |
00213.500640 E |
285,09 |
0 |
7,2 |
3,6 |
289 |
5,2 |
|
ROV SA09 chain station start |
19.mar |
19:20:10 |
5 |
6120.366731 N |
00213.654248 E |
285,89 |
0 |
7,2 |
3,3 |
270 |
5,3 |
|
ROV SA09 chain station stop |
19.mar |
20:15:09 |
5 |
6120.186666 N |
00214.030329 E |
286,15 |
0 |
7,2 |
3,7 |
245 |
5,4 |
|
ROV SA09 control station start |
19.mar |
20:15:55 |
6 |
6120.186748 N |
00214.029926 E |
286,49 |
0 |
7,2 |
3,8 |
249 |
5,4 |
|
ROV SA09 control station stop |
19.mar |
21:09:39 |
6 |
6120.054061 N |
00214.304682 E |
287 |
0 |
7,2 |
4,4 |
295 |
4 |
|
ROV SA09 control station start |
19.mar |
21:49:44 |
7 |
6119.926796 N |
00213.901150 E |
284,36 |
0 |
7,3 |
3,1 |
289 |
4,8 |
|
ROV SA09 control station stop |
19.mar |
22:29:08 |
7 |
6120.218063 N |
00214.064492 E |
286,39 |
0,3 |
7,3 |
3,6 |
279 |
5 |
|
ROV SA09 chain station start |
19.mar |
22:30:20 |
8 |
6120.218399 N |
00214.064678 E |
286,43 |
0 |
7,3 |
2,5 |
269 |
5 |
|
ROV SA09 chain station stop |
19.mar |
23:15:51 |
8 |
6120.353034 N |
00214.138310 E |
287,04 |
0 |
7,2 |
8,1 |
286 |
4,7 |
|
CTD inside wind-farm eDNA with watersample start |
20.mar |
00:32:39 |
218 |
6121.139227 N |
00214.915813 E |
293,13 |
0 |
7,2 |
6 |
280 |
4,7 |
|
CTD inside wind-farm eDNA with watersample stop |
20.mar |
00:44:03 |
218 |
6121.139764 N |
00214.916022 E |
293,4 |
0 |
7,1 |
6,4 |
289 |
4,9 |
|
CTD inside wind-farm nutriens with watersample start |
20.mar |
00:50:00 |
219 |
6121.139700 N |
00214.914754 E |
293,4 |
0 |
7,2 |
6,1 |
305 |
4,9 |
|
CTD inside wind-farm nutriens with watersample stop |
20.mar |
01:01:44 |
219 |
6121.139459 N |
00214.914620 E |
293,1 |
0 |
7,2 |
7,5 |
308 |
4,9 |
|
CTD inside wind-farm eDNA with watersample start |
20.mar |
01:39:30 |
220 |
6119.795289 N |
00215.622629 E |
287,52 |
0 |
7,2 |
6,9 |
321 |
4,8 |
|
CTD inside wind-farm eDNA with watersample stop |
20.mar |
01:53:16 |
220 |
6119.795601 N |
00215.622555 E |
287,67 |
0 |
7,2 |
6,6 |
307 |
4,9 |
|
CTD inside wind-farm with nutriens watersample start |
20.mar |
02:00:17 |
221 |
6119.796015 N |
00215.622700 E |
287,42 |
0 |
7,2 |
7,6 |
312 |
5,1 |
|
CTD inside wind-farm with nutriens watersample stop |
20.mar |
02:11:23 |
221 |
6119.795653 N |
00215.623365 E |
287,39 |
0 |
7,2 |
7,9 |
311 |
5,1 |
|
CTD inside wind-farm eDNA with watersample start |
20.mar |
02:42:48 |
222 |
6118.767885 N |
00216.161353 E |
284,09 |
0 |
7 |
9,2 |
299 |
5,2 |
|
CTD inside wind-farm eDNA with watersample stop |
20.mar |
02:55:32 |
222 |
6118.768503 N |
00216.161603 E |
283,91 |
0 |
7 |
|
|
5 |
|
CTD inside wind-farm nutriens with watersample start |
20.mar |
03:04:48 |
223 |
6118.768459 N |
00216.161966 E |
283,88 |
0 |
7 |
6,2 |
310 |
5,1 |
|
CTD inside wind-farm nutriens with watersample stop |
20.mar |
03:16:13 |
223 |
6118.768441 N |
00216.161529 E |
283,9 |
0 |
7 |
5,4 |
312 |
4,8 |
|
Course change - back on acoustic flower transec line 17 |
20.mar |
07:17:43 |
27 |
6120.335537 N |
00217.133687 E |
294,3 |
7,4 |
7 |
7,2 |
320 |
4,6 |
|
Kayak drone stop |
20.mar |
13:47:00 |
|
|
|
|
|
|
|
|
|
|
Kayak drone start |
20.mar |
16:15:00 |
|
|
|
|
|
|
|
|
|
|
ROV SA12 chain station start |
20.mar |
17:42:35 |
9 |
6119.408749 N |
00214.509032 E |
281,55 |
0 |
7 |
0,9 |
135 |
4,9 |
|
ROV SA12 chain station stop |
20.mar |
19:22:33 |
9 |
6119.280569 N |
00214.768584 E |
282,86 |
0 |
7 |
2,4 |
129 |
4,8 |
|
ROV SA12 control station start |
20.mar |
20:00:18 |
10 |
6119.398981 N |
00214.529712 E |
282,19 |
0 |
7 |
2,4 |
129 |
4,7 |
|
ROV SA12 control station stop |
20.mar |
21:01:12 |
10 |
6119.592447 N |
00214.140650 E |
282,91 |
0 |
7 |
2,2 |
110 |
4,8 |
|
ROV SA12 chain station start |
20.mar |
22:06:30 |
11 |
6119.167329 N |
00214.317875 E |
283,01 |
0 |
7,1 |
2,7 |
125 |
4,8 |
|
ROV SA12 chain station stop |
20.mar |
22:42:39 |
11 |
6119.403683 N |
00214.440751 E |
283,22 |
0,4 |
7 |
2,8 |
120 |
4,7 |
|
ROV SA12 control station start |
20.mar |
22:42:53 |
12 |
6119.405374 N |
00214.441555 E |
283,3 |
0,4 |
7 |
3,3 |
115 |
4,7 |
|
ROV SA12 control station stop |
20.mar |
23:25:35 |
12 |
6119.569651 N |
00214.543397 E |
284,45 |
0 |
7,1 |
3,3 |
138 |
4,9 |
|
Pelagic trawl start - transect in OWF |
21.mar |
01:43:45 |
57 |
6118.377739 N |
00216.390398 E |
281,39 |
3,8 |
7 |
4,6 |
130 |
5 |
|
Pelagic trawl stop - transect in OWF |
21.mar |
02:56:59 |
57 |
6121.541274 N |
00214.761275 E |
294,19 |
1,6 |
7 |
6,5 |
134 |
5,2 |
|
CTD transect HY01 eDNA with watersample start |
21.mar |
03:31:39 |
224 |
6122.172684 N |
00214.626396 E |
297,34 |
0 |
7 |
5 |
123 |
5,1 |
|
CTD transect HY01 eDNA with watersample stop |
21.mar |
03:43:44 |
224 |
6122.171317 N |
00214.631046 E |
297,63 |
0 |
7 |
7,6 |
138 |
4,7 |
|
CTD transect HY01 neutrients with watersample start |
21.mar |
03:49:29 |
225 |
6122.171340 N |
00214.630443 E |
297,36 |
0 |
7 |
9 |
138 |
5 |
|
CTD transect HY01 neutrients with watersample stop |
21.mar |
04:01:25 |
225 |
6122.171580 N |
00214.630965 E |
297,43 |
0 |
7 |
8,6 |
134 |
5 |
|
Pelagic trawl start - fishery transect |
21.mar |
12:19:00 |
58 |
6112.050006 N |
00152.152152 E |
146,56 |
2,8 |
8 |
17 |
122 |
4,4 |
|
Pelagic trawl stop - fishery transect |
21.mar |
12:32:19 |
58 |
6111.645936 N |
00153.075380 E |
145,93 |
2,2 |
7,9 |
15,4 |
118 |
4,4 |
|
Pelagic trawl start - fishery transect |
21.mar |
14:07:18 |
59 |
6116.142937 N |
00201.561494 E |
142,56 |
2,9 |
7,9 |
16 |
117 |
4,4 |
|
Pelagic trawl stop - fishery transect |
21.mar |
14:20:49 |
59 |
6115.666110 N |
00202.484414 E |
142,41 |
3 |
8 |
16,6 |
118 |
4,2 |
|
Pelagic trawl start - fishery transect |
21.mar |
15:53:08 |
60 |
6119.878490 N |
00208.850278 E |
267,1 |
2,7 |
7,9 |
15 |
113 |
4,5 |
|
Pelagic trawl stop - fishery transect |
21.mar |
16:23:09 |
60 |
6120.887656 N |
00207.253944 E |
269,49 |
2,9 |
7,7 |
12,4 |
116 |
4,9 |
|
CTD transect nord start |
22.mar |
10:02:01 |
226 |
6124.034461 N |
00148.172248 E |
153,83 |
0,1 |
8,2 |
14,6 |
134 |
7,5 |
|
CTD transect nord stop |
22.mar |
10:10:43 |
226 |
6124.035089 N |
00148.168158 E |
154 |
0,1 |
8,2 |
13,4 |
140 |
7,6 |
|
CTD transect nord start |
22.mar |
10:37:38 |
227 |
6126.140307 N |
00152.388379 E |
226,62 |
0,1 |
8,5 |
13,2 |
121 |
7,4 |
|
CTD transect nord stop |
22.mar |
10:50:14 |
227 |
6126.139723 N |
00152.387738 E |
226,79 |
0 |
8,5 |
15 |
122 |
7,3 |
|
CTD transect nord start |
22.mar |
11:21:32 |
228 |
6128.336418 N |
00156.598642 E |
297,86 |
0 |
8 |
|
|
6,9 |
|
CTD transect nord stop |
22.mar |
11:33:49 |
228 |
6128.335849 N |
00156.597827 E |
297,81 |
0 |
7,9 |
15,6 |
119 |
7 |
|
CTD transect nord start |
22.mar |
12:05:57 |
229 |
6130.506738 N |
00201.096971 E |
316,48 |
0,1 |
7,4 |
16,1 |
118 |
6,7 |
|
CTD transect nord stop |
22.mar |
12:18:39 |
229 |
6130.508979 N |
00201.097788 E |
316,02 |
0 |
7,5 |
17,1 |
121 |
6,8 |
|
CTD transect nord start |
22.mar |
12:50:17 |
230 |
6132.691791 N |
00205.401769 E |
337,04 |
0 |
7 |
14,9 |
113 |
6,6 |
|
CTD transect nord stop |
22.mar |
13:03:16 |
230 |
6132.690268 N |
00205.402511 E |
336,81 |
0,1 |
7,1 |
14,5 |
117 |
6,7 |
|
CTD transect nord start |
22.mar |
13:35:44 |
231 |
6134.894316 N |
00209.800729 E |
362,38 |
0 |
7,2 |
15 |
118 |
6,6 |
|
CTD transect nord stop |
22.mar |
13:50:49 |
231 |
6134.892981 N |
00209.800060 E |
362,15 |
0 |
7,2 |
16,1 |
122 |
6,7 |
|
CTD transect nord start |
22.mar |
14:52:01 |
232 |
6137.104703 N |
00214.053209 E |
385,43 |
0,3 |
7 |
11,1 |
193 |
7,4 |
|
CTD transect nord stop |
22.mar |
15:06:48 |
232 |
6137.137044 N |
00214.241121 E |
386,06 |
0,5 |
7 |
11,8 |
202 |
8 |
|
CTD transect nord start |
22.mar |
15:31:56 |
233 |
6138.942693 N |
00217.838739 E |
378,27 |
0,2 |
7,2 |
13,3 |
197 |
8 |
|
CTD transect nord stop |
22.mar |
15:47:23 |
233 |
6138.953147 N |
00217.964958 E |
379,19 |
0,6 |
7,2 |
13,4 |
198 |
7,9 |
|
CTD transect central nord start |
22.mar |
17:02:19 |
234 |
6132.977090 N |
00229.861959 E |
373,5 |
1,9 |
7,9 |
12,2 |
188 |
7,8 |
|
CTD transect central nord stop |
22.mar |
17:18:25 |
234 |
6133.000125 N |
00229.983432 E |
372,05 |
0,3 |
7,8 |
12,8 |
178 |
7,8 |
|
CTD transect central nord start |
22.mar |
17:45:17 |
235 |
6131.056886 N |
00225.977180 E |
380,93 |
0,7 |
7,9 |
13,3 |
180 |
7,9 |
|
CTD transect central nord stop |
22.mar |
18:01:48 |
235 |
6131.058188 N |
00226.331790 E |
380,3 |
0,7 |
7,9 |
12,9 |
192 |
7,3 |
|
CTD transect central nord start |
22.mar |
18:30:05 |
236 |
6128.891178 N |
00221.649371 E |
366,1 |
0,4 |
7,8 |
10 |
166 |
7,3 |
|
CTD transect central nord stop |
22.mar |
18:44:51 |
236 |
6128.922139 N |
00221.799126 E |
366,95 |
0,2 |
7,8 |
14,2 |
177 |
7 |
|
CTD transect central nord start |
22.mar |
19:15:21 |
237 |
6126.723397 N |
00217.353152 E |
331,07 |
0 |
8 |
11,2 |
175 |
6,5 |
|
CTD transect central nord stop |
22.mar |
19:29:53 |
237 |
6126.747362 N |
00217.585875 E |
331,42 |
0,7 |
8 |
7,2 |
177 |
6,2 |
|
CTD transect central nord start |
22.mar |
20:02:44 |
238 |
6124.619798 N |
00213.003333 E |
307,29 |
0,2 |
8,1 |
9,7 |
182 |
6,5 |
|
CTD transect central nord stop |
22.mar |
20:15:29 |
238 |
6124.631656 N |
00213.255122 E |
309,51 |
0,5 |
8,1 |
8,6 |
198 |
6,2 |
|
CTD transect central nord start |
22.mar |
20:51:47 |
239 |
6122.369430 N |
00208.779556 E |
287,47 |
0,8 |
8,1 |
9,3 |
222 |
6,9 |
|
CTD transect central nord stop |
22.mar |
21:04:31 |
239 |
6122.351307 N |
00209.125266 E |
287,89 |
0,8 |
8,1 |
10,1 |
224 |
7 |
|
CTD transect central south start |
22.mar |
21:39:50 |
240 |
6120.168986 N |
00204.463087 E |
245,69 |
0,5 |
8,1 |
13,4 |
231 |
6,7 |
|
CTD transect central south stop |
22.mar |
21:50:54 |
240 |
6120.071052 N |
00204.738426 E |
245,02 |
0,5 |
8,1 |
14,1 |
237 |
6,8 |
|
CTD transect central south start |
22.mar |
22:24:53 |
241 |
6118.034884 N |
00200.104124 E |
146,83 |
0,4 |
8 |
16,6 |
235 |
6,5 |
|
CTD transect central south stop |
22.mar |
22:32:41 |
241 |
6117.975804 N |
00200.224495 E |
146,96 |
0,6 |
8 |
15,3 |
238 |
6,3 |
|
CTD transect central south start |
23.mar |
05:35:46 |
242 |
6112.331771 N |
00209.696875 E |
138,19 |
0,2 |
8,2 |
8 |
192 |
7,6 |
|
CTD transect central south stop |
23.mar |
05:43:53 |
242 |
6112.324771 N |
00209.773135 E |
138,82 |
0,3 |
8,2 |
7,3 |
182 |
7,6 |
|
CTD transect central south start |
23.mar |
06:10:02 |
243 |
6114.432066 N |
00213.985507 E |
222,62 |
0,9 |
8,1 |
8,7 |
185 |
7,6 |
|
CTD transect central south stop |
23.mar |
06:26:16 |
243 |
6114.492001 N |
00214.463040 E |
228,53 |
6,5 |
8,1 |
4,9 |
178 |
7,7 |
|
CTD transect central south start |
23.mar |
06:56:39 |
244 |
6116.556932 N |
00218.760534 E |
272,16 |
0,7 |
8 |
7,9 |
173 |
7,4 |
|
CTD transect central south stop |
23.mar |
07:07:46 |
244 |
6116.568044 N |
00219.027792 E |
273,06 |
0,6 |
8 |
7,9 |
173 |
7,5 |
|
CTD transect central south start |
23.mar |
07:35:36 |
245 |
6118.579648 N |
00223.045078 E |
297,11 |
0,6 |
8,1 |
6,9 |
185 |
7,5 |
|
CTD transect central south stop |
23.mar |
07:49:18 |
245 |
6118.584925 N |
00223.173075 E |
298,2 |
0,4 |
8,1 |
6,5 |
181 |
7,4 |
|
CTD transect central south start |
23.mar |
08:18:26 |
246 |
6120.708552 N |
00227.418049 E |
323,22 |
0,3 |
7,9 |
6,3 |
169 |
7,3 |
|
CTD transect central south stop |
23.mar |
08:32:59 |
246 |
6120.719081 N |
00227.580897 E |
324,87 |
0,2 |
7,9 |
6,5 |
166 |
7,4 |
|
CTD transect central south start |
23.mar |
09:01:31 |
247 |
6122.948848 N |
00231.880887 E |
368,16 |
0,1 |
7,4 |
4,7 |
145 |
7,3 |
|
CTD transect central south stop |
23.mar |
09:16:58 |
247 |
6122.963215 N |
00232.058664 E |
367,94 |
0,4 |
7,3 |
7,8 |
143 |
7,4 |
|
CTD transect central south start |
23.mar |
09:44:34 |
248 |
6125.043370 N |
00236.276511 E |
378,29 |
0,3 |
7,1 |
6,1 |
148 |
7,2 |
|
CTD transect central south stop |
23.mar |
10:03:19 |
248 |
6125.051950 N |
00236.482743 E |
378,98 |
0,1 |
7,1 |
4,5 |
146 |
7,1 |
|
CTD transect central south start |
23.mar |
10:32:30 |
249 |
6127.077953 N |
00240.859521 E |
376,4 |
0,6 |
7,1 |
7,1 |
138 |
6,6 |
|
CTD transect central south stop |
23.mar |
10:48:11 |
249 |
6127.108893 N |
00241.076039 E |
376,66 |
0,6 |
7 |
5,1 |
129 |
6,4 |
|
CTD south start |
23.mar |
12:03:35 |
250 |
6118.223802 N |
00249.262894 E |
378,75 |
0,1 |
6,9 |
7,7 |
126 |
6,5 |
|
CTD south stop |
23.mar |
12:18:12 |
250 |
6118.221372 N |
00249.250330 E |
378,9 |
0,2 |
6,9 |
6,9 |
125 |
6,6 |
|
CTD south start |
23.mar |
12:48:01 |
251 |
6116.161326 N |
00244.760437 E |
375,03 |
0,4 |
7 |
8,5 |
132 |
6,9 |
|
CTD south stop |
23.mar |
13:02:37 |
251 |
6116.175662 N |
00244.555308 E |
372,78 |
0,2 |
7 |
8 |
130 |
6,9 |
|
CTD south start |
23.mar |
13:35:08 |
252 |
6114.027851 N |
00240.307205 E |
322,13 |
0,5 |
7,2 |
8,1 |
127 |
6,6 |
|
CTD south stop |
23.mar |
13:48:05 |
252 |
6114.087357 N |
00240.056279 E |
321,75 |
0,7 |
7,2 |
9,2 |
127 |
6,5 |
|
ROV station start ADCP4 |
23.mar |
18:55:41 |
13 |
6120.747482 N |
00213.569013 E |
288,41 |
0,1 |
8,2 |
7,4 |
43 |
6,4 |
|
ROV station stop ADCP4 |
23.mar |
19:17:44 |
13 |
6120.747616 N |
00213.570130 E |
288,51 |
0 |
8,2 |
7 |
61 |
6,8 |
|
ROV station start Hydrophon |
23.mar |
20:08:39 |
14 |
6120.572324 N |
00213.602116 E |
287,3 |
0 |
8,2 |
11,7 |
56 |
6,2 |
|
ROV station stop Hydrophon |
23.mar |
21:40:21 |
14 |
6120.571310 N |
00213.603265 E |
287,71 |
0 |
8,2 |
9,1 |
38 |
6,2 |
|
ROV station start ADCP1 |
23.mar |
22:06:08 |
15 |
6120.803067 N |
00215.549517 E |
294,48 |
0 |
8 |
8,3 |
40 |
6,3 |
|
ROV station stop ADCP1 |
23.mar |
22:53:37 |
15 |
6120.802970 N |
00215.548634 E |
294,18 |
0 |
8,1 |
5,3 |
32 |
6,3 |
|
The 3 ADCP’s outside the windfarm area was released by acoustic releasers |
23. mar |
Between 20:08 and 21:40 |
|
|
|
|
|
|
|
|
|