Barents Sea Capelin - Report of the Joint Russian-Norwegian Working Group on Arctic Fisheries (JRN-AFWG) 2023
Report series:
IMR-PINRO 2023-9Published: 20.10.2023 Research group(s):
Pelagisk fiskProgram:
Barentshavet og Polhavet Approved by:
Research Director(s):
Geir Huse
Program leader(s):
Maria Fossheim
Barentshavslodde - rapport frå Den bilaterale norsk-russiske arbeidsgruppa for arktiske fiskeri (JRN-AFWG) 2023
Den bilaterale norsk-russiske arbeidsgruppa for arktiske fiskeri (JRN-AFWG) hadde møte per korrespondanse 9.-10. oktober 2023 for bestandsvurdering og kvoterådgjeving på barentshavslodde.
Den geografiske dekninga av loddebestanden under toktet i Barentshavet hausten 2023 var tilnærma fullstendig, og biomassen ab den totale bestanden blei berekna til 2.952 millionar tonn. Omlag 44% (1.286 million tonn) av totalbiomassen var modnande fisk (>14.0 cm). Gjennomsnittsvekt ved alder i 2023 var lågare enn langtidssnittet for fisk eldre enn 2 år. Antalet 3 og 4-åringar var det høgaste sidan 1992 og 1980, høvesvis. Talet på 1-åringar var 108.5 milliardar, som er om lag halvparten av langtidssnittet.
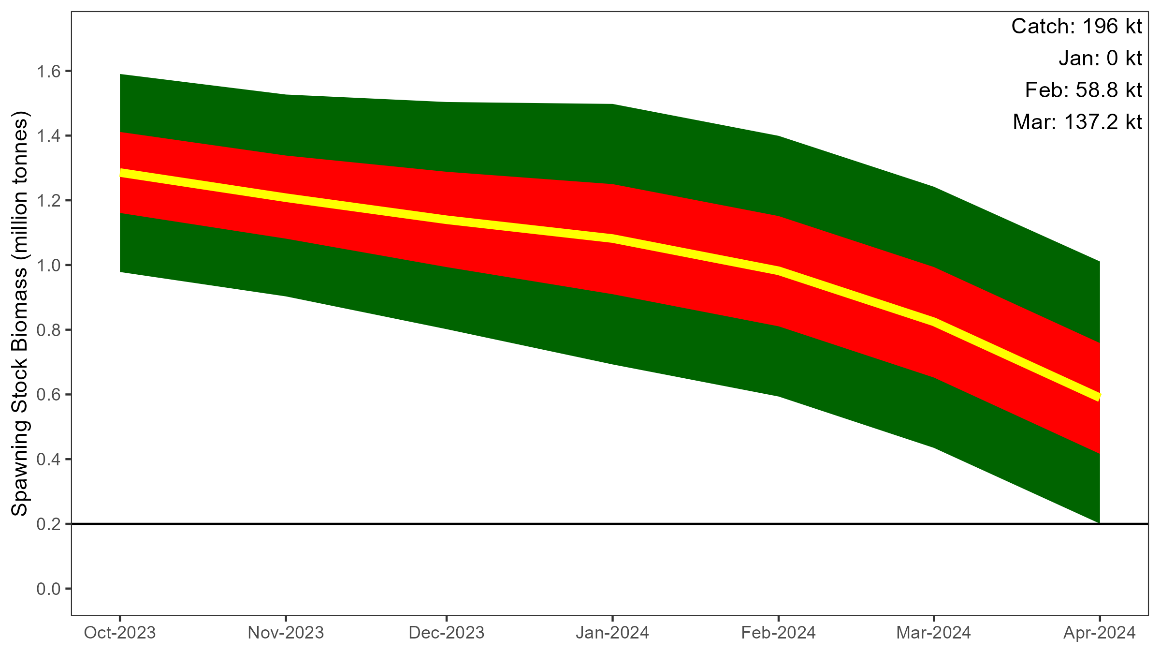
I bestandsrådgjevinga for lodde blir det gjennomført ei framskriving av den modnande loddebiomassen frå 1. oktober til 1. april (gytetidspunkt) året etter. Framskrivingsmodellen (bifrost) inneheld ein eigen modul for torskekonsum av lodde, og modellen brukt i årets bestandsvurdering var revidert etter ICES metoderevisjonsmøtet for lodde i november 2022. I framskrivinga blei median gytebiomasse 1. april 2024 berekna til 785 000 tonn utan fangst (90% konfidensintervall: 392-1207 000 tonn), og sannsynet for å ligga over referansepunktet (200 000 tonn) i haustingsregelen var 99.8%. Med ein fangst på 196 000 tonn er det 5% sannsyn for at gytebiomassen er under referansepunktet som er i tråd med haustingsregelen. Median gytebiomasse i 2024 med ein fangst på 196 000 blei berekna til 590 000 tonn (90% konfidensintervall: 201-1011 000 tonn). Torskekonsum i perioden januar-mars 2024 i dette scenariet er berekna til 296 000 tonn.
1 - Barents Sea Capelin
1.1 - Barents Sea Capelin
The Joint Russian-Norwegian Arctic Fisheries Working Group (JRN-AFWG) met by correspondence 9-10 October 2023 to assess and give quota advice for the Barents Sea capelin stock.
Participants:
Bjarte Bogstad (Norway, Chair of meeting)
Anatoly Chetyrkin (Russia)
Sondre Nedreås Hølleland (Norway)
Stine Karlson (Norway)
Yury Kovalev (Russia)
Pavel Krivosheya (Russia)
Dmitry Prozorkevich (Russia)
Frøydis Rist (Norway)
Georg Skaret (Norway)
Alexey Stesko (Russia)
1.2 - Regulation of the Barents Sea Capelin Fishery
Since 1979, the Barents Sea capelin fishery has been regulated by a bilateral fishery management agreement between Russia (former USSR) and Norway. A TAC has been set separately for the winter fishery and for the autumn fishery. From 1999, no autumn fishery has taken place, except for a small Russian experimental fishery in some years and small by-catch in the northern shrimp fishery. A minimum landing size of 11 cm has been in force since 1979. Scientific advice is to carry out capelin fishery only on mature fish during the period from January to April.
1.3 - TAC and Catch Statistics (Table 10.1-10.2 )
The Joint Norwegian-Russian Fishery Commission (JNRFC) set a TAC of 70 000 tonnes for 2022 and 62 000 tonnes for 2023. For both years, the quotas were in accordance with the advice. The international historical catch by country and season in the years 1965–2023 is given in Table 10.1. The Norwegian catch in 2023 was 37652 tonnes which was 502 tonnes above the national TAC. Russian catches were 23 040 tonnes which was 1810 tonnes below the national TAC.
The age-length distribution of Norwegian and Russian catches in 2023 are summarized in Table 10.2a-b. The capelin sampling from the Barents Sea in 2023 is summarised below:
Investigation
No. of trawl hauls
Length measurements
Agedindividuals
Sampling from fishing vessels in winter-spring 2023 (Norway)
16
1539
480
Sampling from fishing vessels in winter-spring 2023 (Russia)
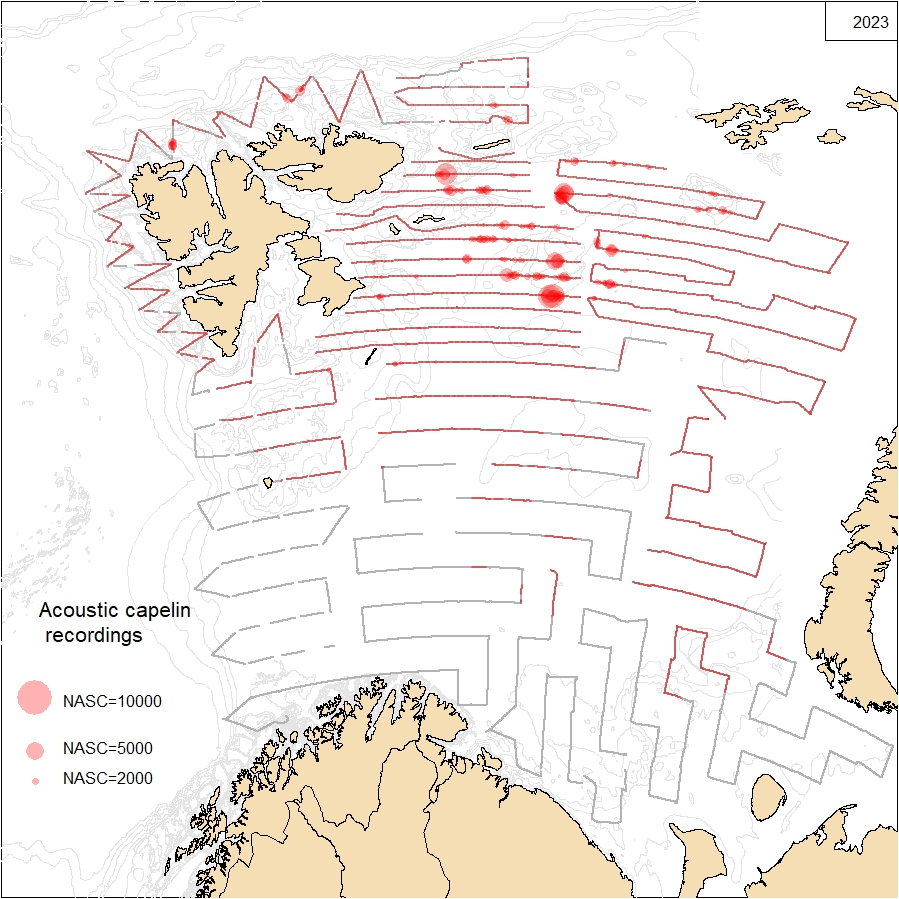
The geographical survey coverage of the Barents Sea capelin stock during the BESS in 2023 was close to complete; the capelin distribution seemed to continue a little bit further northwards in the north-east. The geographical distribution of capelin in 2023 is shown in Figure 10.1.
As decided during the 2016 assessment meeting, the capelin abundance was estimated using the software StoX v.2.7 (Johnsen et al. 2019), applying standard settings (see background document BS0 in Annex 3 in ICES, 2023). Since this old java-based StoX program is no longer maintained and has been replaced with an R-based version, the estimate was also made in new StoX (v.3.6). The difference in estimates between the versions was negligible.
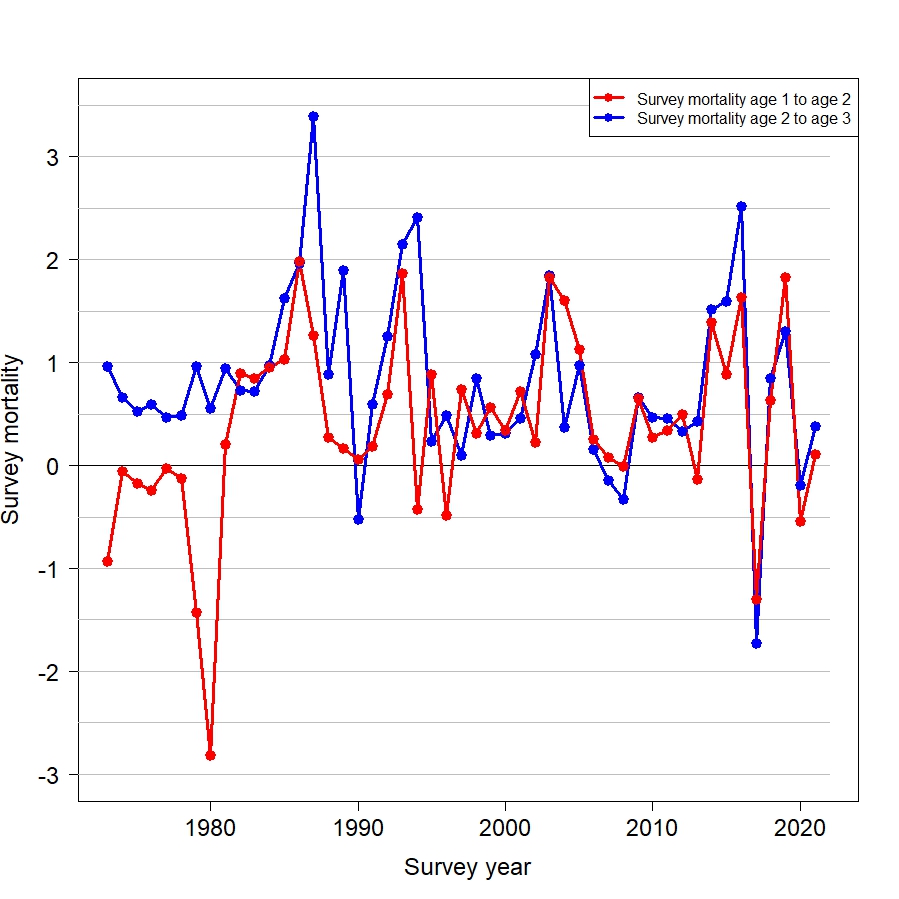
The stock estimate from the area covered by the 2023 survey was 2.952 million tonnes (Table 10.3). About 44% (1.286 million tonnes) of the estimated stock biomass consisted of maturing fish (>14.0 cm). The mean weight at age in the 2023 survey was low than the long-term average for ages 2 and older (Figure 10.2). The abundance of age 3 and 4 fish was the highest since 1992 and 1980, respectively. Estimates of stock in number by age group and total biomass for the historical period are shown in Table 10.4. The stock numbers and biomass for 2004-2021 are updated following the data evaluation workshop in 2021, and the subsequent WKCAPELIN benchmark in 2022. The comparison with previous estimates is presented in detail in Annex3 number BS0 in the WKCAPELIN benchmark report (ICES, 2023). Survey mortality for ages 1-2 and 2-3 is shown in Figure 10.3.
A fixed sampling variance expressed as Coefficient of Variation (CV) of 0.2 for all age groups has previously been applied as input for CapTool for the forecast in the capelin assessment (Tjelmeland 2002; Gjøsæter et al. 2002). The survey design and estimation software now allow for estimation of a direct CV by age group. CV estimates by age group for the years 2004-2021 and 2023 are given in Table 10.5. It was found that age groups with very low abundance in the survey usually have very high CVs. That is expected since there are only few observations in the survey for such age groups. Vice versa an abundant age group normally has much lower CV. WKCAPELIN recommended to use the average CV for each age group from the 5 the last five years with high-quality surveys in the stock projection. However, including age groups with very low abundance in the averaging is inappropriate.
Because of the incomplete spatial coverage in 2022, that year was not included in the averaging. Averaging the CVs for 2018-2021 and 2023 by age group gave quite high values for ages 3 and 4, as shown in the text table below. Since the abundance estimates for ages 3 and 4 in 2023 are much higher than in any of the years 2018-2021, and the CVs for ages 2, 3 and 4 in 2023 are relatively similar, it was not considered appropriate to use the 2018-2021 and 2023 averages for ages 3 and 4. Using the average of CVs weighted by abundance was explored. However this gave a very low value for age 2 (0.14) due to high weight to the estimated CV for age 2 in 2021 (0.10) when the abundance was very high. It was decided to use the unweighted average for the years 2018-2021 and 2023 for ages 1 and 2 and apply this value for ages 3 and 4 also, based on the similarity in CV for 2023 for ages 2, 3 and 4. The summary results are presented below:
CV
Age 1
Age 2
Age 3
Age 4
Average
0.22
0.22
0.29
0.57
Weighted average
0.23
0.14
0.21
0.22
2023
0.28
0.17
0.17
0.20
Value to use
0.22
0.22
0.22
0.22
A methodology for handling very small or very large CV values and abundance estimates of different orders of magnitude in the averaging should be explored, together with exploring using annual CVs. With a low CV there is a risk that sampling variance is not a good reflection of total uncertainty, since other sources of uncertainty than sampling variance could dominate the total uncertainty.
1.4.2 - Stock assessment in 2023 (Table 10.4-10.5, Figure 10.4-10.6)
All projections described below were based on a maturation and predation model as described in the 2023 WKCAPELIN Benchmark report (ICES, 2023), with parameters estimated by the model Bifrost and data on predicted cod abundance and size at age in 2024 from the 2023 Bilateral Norwegian-Russian Assessment Group (Anon. 2023).
The methodology is described in the Benchmark report (ICES 2023). The changes from the previous model are described in section 10.3.3.
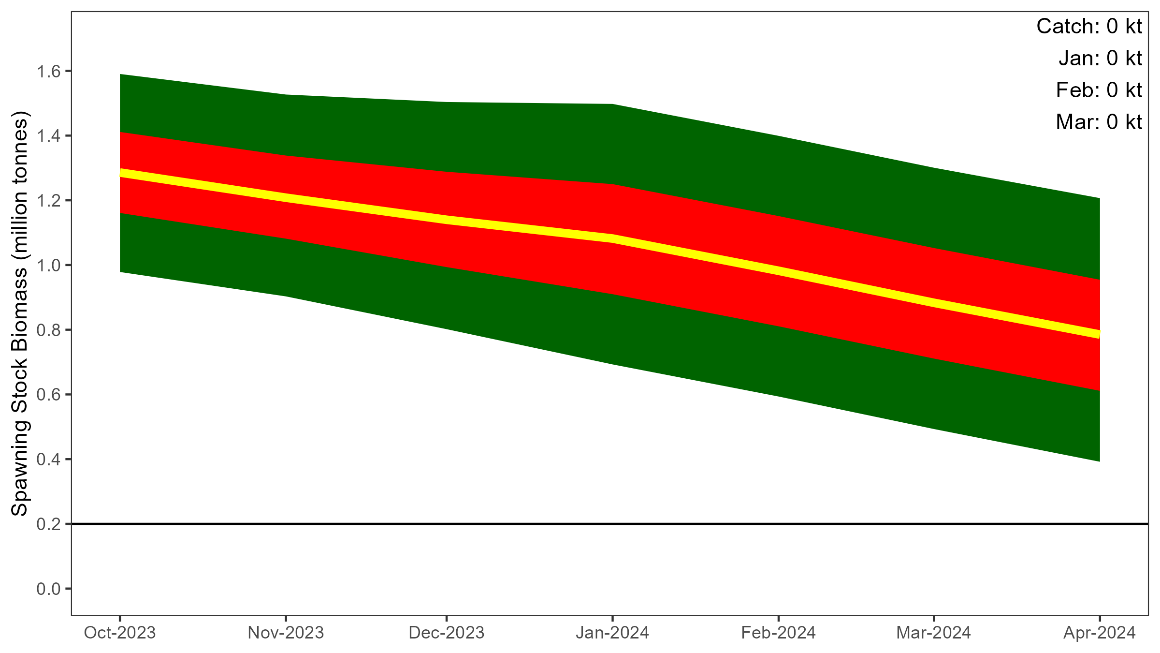
With no catch, the estimated median spawning stock size on 1 April 2024 is 785 000 tonnes (90% confidence interval: 392-1207 000 tonnes) (Figure 10.4), and the probability for the spawning stock to be above 200 000 tonnes is 99.8 %.
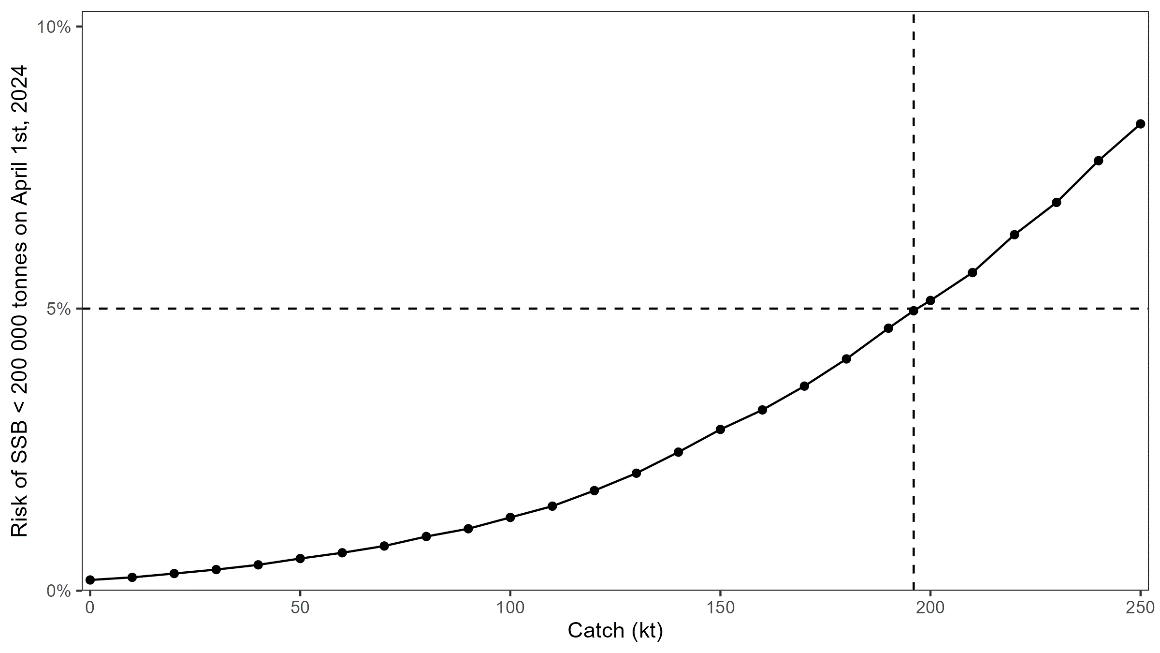
With a catch of 196 000 tonnes, the probability for the spawning stock in 2024 to be below 200 000 tonnes, is 5 % (Figure 10.4). The median spawning stock size in 2024 will then be 590 000 tonnes (90% confidence interval: 201-1011 000 tonnes), and the corresponding median modelled consumption by immature cod in the period January-March 2024 will then be 296 000 tonnes. Figure 10.5 shows the probability of SSB < 200 000 tonnes as a function of the catch.
As in previous years, the catch corresponding to 95% probability of being above 200 000 tonnes is calculated to the nearest 1000 tonnes.
For comparison, half-year predictions and quota advice was also calculated using the previous assessment model which gave a TAC advice of about 145 000 tonnes.
The 2022 estimate should be corrected based on the 2021 and 2023 estimates and such correction may be made in the future.
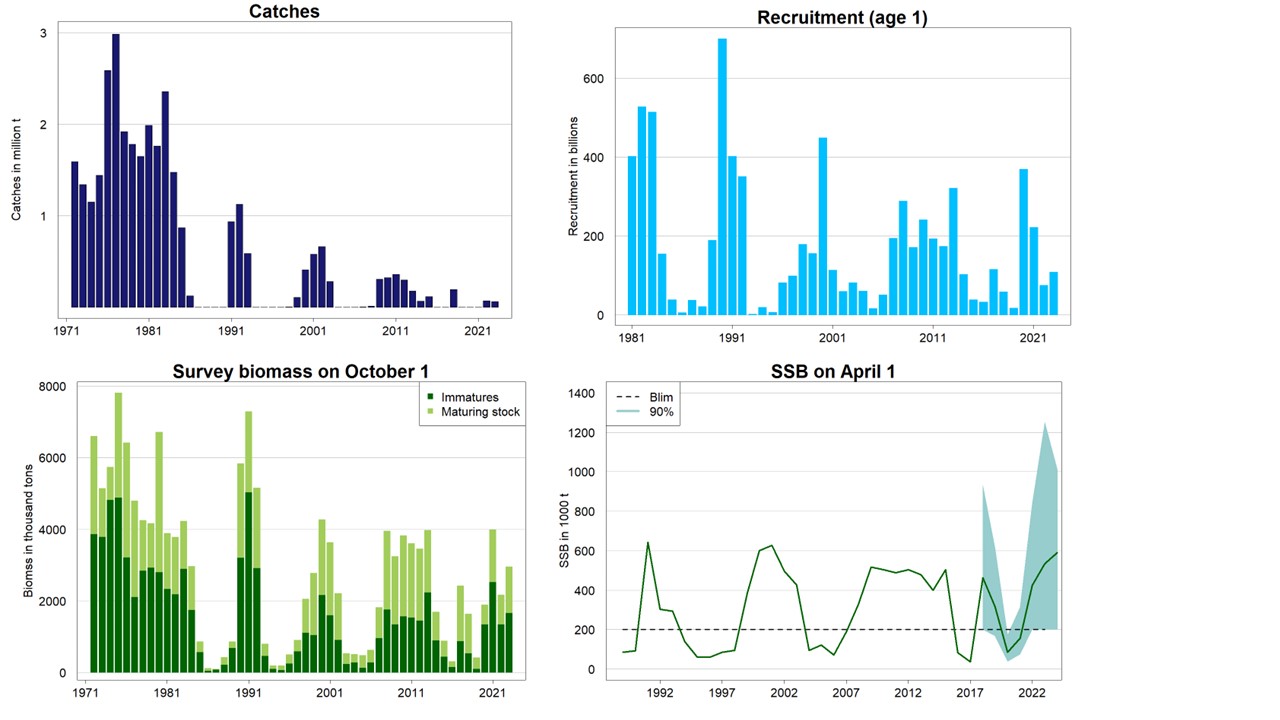
Summary plots for catch, stock size and recruitment are given in Figure 10.6.
Recruitment
The 0-group series was recalculated by WGIBAR in 2022 (ICES 2022). No 0-group estimate was yet available for 2023.
The 1-group abundance in 2023 in the area covered by the survey was 108.5 billion which is about half the long-term average (Table 10.4).
High abundance of young herring (mainly age groups 1 and 2) has been suggested to be an important but not a single factor causing recruitment failure in the capelin stock (Hjermann et al., 2010; Gjøsæter et al. 2016). In 2022, high abundance of 0-group herring was observed during the BESS. Preliminary results from BESS 2023 shows some areas with high acoustic herring recordings, but no abundance estimates of herring in the Barents Sea for 2023 were available at the time of the 2023 capelin assessment.
1.4.3 - Benchmark results and changes from last year
An ICES benchmark meeting joint for the Iceland East Greenland Jan Mayen capelin and Barents Sea capelin (WKCAPELIN) was held in Reykjavik 21-25 November 2022 (ICES, 2023). The benchmark was held without Russian participation due to their suspension from ICES, but all information from the benchmark has been shared with Russian scientists. A summary of the main outcome relevant for Barents Sea capelin is given below. The benchmark treated issues related to monitoring and abundance estimation and stock projection model, and basis for the harvest control rule. The outcome regarding estimation of survey CV is described in section 10.3.1 and the outcome regarding the reference point and basis for the harvest control rule is discussed in section 10.4.
Swept area estimates of capelin near the bottom
Some capelin are present in the acoustic dead zone close to the bottom, and these are currently not included in the survey estimate. A method for adding capelin swept area estimates from demersal trawl to the acoustic estimate was presented to WKCAPELIN, but it was not accepted by the benchmark group in its present form. There are strong outliers in the data with significant impact on the estimate, and the method for treating these outliers was not accepted by WKCAPELIN. A method for estimating the combined uncertainty from swept area and acoustic estimates must also be developed prior to possible implementation. These issues could be resolved in a revision earlier than the next benchmark meeting.
Selection of trawl stations to attain length distributions used for the acoustic estimate
In the BESS capelin are sampled using three platforms; 0-group trawl hauls at fixed positions, demersal trawl hauls at fixed positions and pelagic target hauls on significant acoustic recordings. There is currently no standard method for which trawl stations to include in order to obtain length distributions for the acoustic estimate. A contribution to WKCAPELIN showed the impact of using different selections of stations, both on the estimate and on consistency in age group composition in the time series. WKCAPELIN recommended to be careful with inclusion of length distributions from demersal trawl hauls since consistency then was poor, but a standard method could not be recommended since the outcome of all alternatives were not on the table at the WKCAPELIN meeting. This could be addressed in a revision earlier than the next benchmark meeting.
Capelin spawning survey
Presently only results from the annual Barents Sea ecosystem survey in autumn are used as input on capelin stock status for the assessment. A survey close to spawning and close to when the fishery happens can potentially reduce uncertainty in the assessment by eliminating some sources of uncertainty in the stock projection. Norway has conducted a capelin spawning survey from 2019-2023, and WKCAPELIN evaluated t he quality of the survey to be appropriate for advice, but there are issues with the survey coverage on the Russian side due to the present political situation, so no proposal to implement the survey results in the annual stock assessment and advice process was forwarded. WKCAPELIN recommended that results from the survey could be used as a fallback in case of failure of the autumn survey.
The 2023 survey was carried out 26 February–9 March 2023 using the fishing vessel ‘Vendla’ (Skaret et al. 2023). The surveying of the capelin spawning migration was successful and the estimate of ca. 275 000 tonnes with a CV of 0.35 was within the uncertainty range from the predictions made in the autumn 2022.
Estimating proportion maturing capelin
In the stock projection of maturing capelin from 1 October to 1 April next year, the proportion of maturing capelin relative to total amount of capelin must first be estimated. The proportion has been estimated as a function of capelin length where the parameters are P1 (intensity of maturation) and P2 (median 50% length at maturation). A likelihood function has been used in the estimation comparing abundance of immatures at age 2 and 3, respectively in year Y with abundance of all capelin at age 3 and 4, respectively in year Y+1, so a natural mortality parameter (P3) has also been used. P3 is kept fixed since the years 1972-1980 is used to estimate P1 and P2 and P3 for that period is assumed to be stable. A fixed P1 estimate of 3.5 has been used in the assessment, and 1000 replicates of P2 from CapTool based on a P2 estimate of 13.89 ± SD=0.075. The parameter settings of P1 and P2 were evaluated during WKCAPELIN, but no new estimates were made. The existing estimates are therefore kept the same, but a P2 of 14 cm and a high value of P1(resulting in a cut-off maturation length) should be consistently used for both stochastic stock projection and estimates of spawning stock on historical data (this has not been consistent before).
Estimating capelin mortality from 1 October to 1 January
Capelin mortality from 1 October to 1 January is based on estimates from survey data. Previously, replicates were estimated in Bifrost from observed abundance of immature capelin in the autumn survey at age 2 in year Y versus observed total abundance of capelin at age 3 in year Y+1 and observed abundance of immature capelin at age 3 in year Y versus observed total abundance of capelin at age 4 in year Y+1 using the maturation function parameters described in the section above. From these estimates, a selection of annual estimates (The years 1980-1985, 1990-1993 and 1997-2002) were selected based on expert evaluation and included in the assessment. During WKCAPELIN it was agreed that autumn mortality should only be based on observed abundance of immatures in the autumn survey at age 2 in Year Y versus observed total abundance of capelin at age 3 in year Y+1. A cut-off at 14 cm is used to separate out maturing capelin. All years after 1987 (abnormal ecosystem state prior to this year due to NSS-herring collapse) are included, except years associated with the anomalous survey year 2016. No replicates are generated, simulations are based on random selection of estimated annual mortalities. For some years negative mortalities are estimated. These are also included to reflect that negative mortality can result from under-estimates of abundance at age in the autumn survey.
Capelin mortality from 1 January to 1 April (cod consumption)
Capelin natural mortality from 1 January to 1 April in the stock projection is modelled explicitly as consumption by immature cod. For WKCAPELIN, both the consumption model and the empirical cod consumption data used to fit the model were reviewed. Previously, cod consumption was based on a Type II predator-prey functional response. The functional response was fitted to empirical consumption through a likelihood optimization in Bifrost to estimate the parameter pair Bmax (maximum consumption) and B1/2 (prey biomass at half of the maximum consumption). 1000 replicas were estimated and used in CapTool, but the parameter values estimated unintendedly implied that for almost all replicas the functional response curve became one of Type I for the range of capelin biomass observed. In the annual assessment, pairs were selected randomly from the replicates for each simulation run. WKCAPELIN agreed that a Type III functional response with possibility for prey switching at low capelin levels was most appropriate to reflect cod consumption of capelin. The parameters are fitted to updated estimates of consumption based on annual estimates of consumption by cod as presented to ICES AFWG using the methodology described in Bogstad and Mehl (1997).
A cod component assumed to not feed on maturing capelin due to its northerly geographical distribution - the ‘Svalbard component’ was previously defined based on annual estimates of proportion of immature cod by age not overlapping with maturing capelin from 1983-2003. The estimates used a combination of surveys as proxies for the abundance of young cod off Svalbard during 1 January to 1 April. The ‘Svalbard component’ was updated for WKCAPELIN and is now based on winter survey data from 2014-2023.
The cod abundance in January-March is no longer calculated assuming mortality for cod; mortality and growth of cod in this period are assumed to cancel out.
Retrospective analysis
Gjøsæter et al. (2015) calculated what the quota advice and spawning stock would have been in the period 1991—2013, given the present assessment model and updated knowledge about the cod stock. They replaced the cod composition and abundance from the forecast with the updated data from the cod assessment model run later in time. When they reran the model, they showed that considerably smaller annual quotas would have been advised if the updated cod stock information had been known at the time of the assessment. Following from this work, a retrospective analysis of the capelin assessment as well as of the assessment performance should be included annually. This is a feature which so far has been missing from the capelin assessment.
1.5 - Reference points
A Blim (SSBlim) management approach has been suggested for this stock (Gjøsæter et al., 2002). In 2002, the JNRFC agreed to adopt a management strategy based on the rule that, with 95% probability, at least 200 000 tonnes of capelin should be allowed to spawn. Consequently, 200 000 tonnes was used as a Blim. Alternative harvest control rules of 80, 85 and 90% probability of SSB > Blim were suggested by JNRFC and evaluated by ICES (ICES 2016). ICES considers these rules not to be precautionary. At its 2016 meeting, JNRFC decided not to change the adopted management strategy.
The Blim used up until present is based on SSB in 1989 (estimated to 96 000 tonnes) with an uncertainty buffer added (SSB + uncertainty buffer assumed to add up to 200 000 tonnes). The SSB in 1989 is the lowest in the time series which resulted in good recruitment.
In WKCAPELIN it was considered that Blim should not be based on years which are affected by the NSS-herring collapse in the Barents Sea, like is the case for 1989. Among the included years, 1990 (68 000 tonnes) had the lowest estimated SSB that still produced an above average recruitment.
The procedure of including an uncertainty buffer to Blim like it was done previously, was not accepted by WKCAPELIN. Separate terms for the biological reference point (Blim) and the reference point used in the harvest control rule (Bescapement) were therefore introduced. A Bescapement of 200 000 tonnes was evaluated to still be precautionary by WKCAPELIN, but it has not been evaluated whether it would be precautionary to set Bescapement lower, potentially as low as Blim. This year’s advice is thus based on a Bescapement of 200 000 tonnes, as in previous years.
1.6 - References
Anon. 2023. Report of the Joint Russian-Norwegian Working Group on Arctic Fisheries (JRN-AFWG) 2023. IMR-PINRO Report Series 7-2023, 189 pp.
Bogstad, B., and Mehl, S. 1997. Interactions Between Atlantic Cod (Gadus morhua) and Its Prey Species in the Barents Sea. Pp. 591-615 in Proceedings of the International Symposium on the Role of Forage Fishes in Marine Ecosystems. Alaska Sea Grant College Program Report No. 97-01. University of Alaska Fairbanks.
Gjøsæter, H., B. Bogstad, and S. Tjelmeland. 2002. Assessment methodology for Barents Sea capelin, Mallotus villosus (Müller). ICES Journal of Marine Science 59:1086-1095.
Gjøsæter, H., B. Bogstad, S. Tjelmeland, and S. Subbey. 2015. A retrospective evaluation of the Barents Sea capelin management advice. Marine Biology Research 11:135-143.
Gjøsæter, H., Hallfredsson, E. H., Mikkelsen, N., Bogstad, B., and Pedersen, T. 2016. Predation on early life stages is decisive for year class strength in the Barents Sea capelin (Mallotus villosus) stock. ICES Journal of Marine Science 73(2):182-195.
Hjermann, D. Ø., B. Bogstad, G. E. Dingsør, H. Gjøsæter, G. Ottersen, A. M. Eikeset, and N. C. Stenseth. 2010. Trophic interactions affecting a key ecosystem component: a multi-stage analysis of the recruitment of the Barents Sea capelin. Canadian Journal of Fisheries and Aquatic Sciences 67:1363-1375.
ICES. 2016. Report of the second Workshop on Management Plan Evaluation on Northeast Arctic cod and haddock and Barents Sea capelin, 25–28 January 2016, Kirkenes, Norway. ICES CM 2016/ACOM:47. 76 pp. https://doi.org/10.17895/ices.pub.5296.
ICES. 2022. Working Group on the Integrated Assessments of the Barents Sea (WGIBAR). ICES Scientific Reports. 4:50. 235 pp. http://doi.org/10.17895/ices.pub.20051438
Johnsen, E., A. Totland, Å. Skålevik, A. J. Holmin, G. E. Dingsør, E. Fuglebakk, and N. O. Handegard. 2019. StoX: An open source software for marine survey analyses. Methods in Ecology and Evolution 10:1523-1528.
Skaret, G., D. Prozorkevich, H. Gjøsæter, and B. Bogstad. 2018. Evaluation of potential sources of error leading to an underestimation of the capelin stock in 2016. Page 217 in Influence of Ecosystem Changes on Harvestable Resources at High Latitudes. The Proceedings of the 18th Russian-Norwegian Symposium. IMR/PINRO Joint Report Series, Murmansk, Russia.
Skaret, G., Totland, A., Tenningen, M., Hermansen, E., Kristiansen, J., and Pena, H. 2023. Testing of trawl-acoustic stock estimation of spawning capelin 2023. IMR survey report 5/2023, 31 pp.
Tjelmeland, S. 2002. A model for the uncertainty around the yearly trawl-acoustic estimate of biomass of Barents Sea capelin, Mallotus villosus (Müller). ICES Journal of Marine Science 59:1072-1080.
Year
Winter-Spring
Summer-Autumn
Total
Norway
Russia
Others
Total
Norway
Russia
Total
1965
217
7
0
224
0
0
0
224
1966
380
9
0
389
0
0
0
389
1967
403
6
0
409
0
0
0
409
1968
460
15
0
475
62
0
62
537
1969
436
1
0
437
243
0
243
680
1970
955
8
0
963
346
5
351
1314
1971
1300
14
0
1314
71
7
78
1392
1972
1208
24
0
1232
347
13
360
1591
1973
1078
34
0
1112
213
12
225
1337
1974
749
63
0
812
237
99
336
1148
1975
559
301
43
903
407
131
538
1441
1976
1252
228
0
1480
739
368
1107
2587
1977
1441
317
2
1760
722
504
1226
2986
1978
784
429
25
1238
360
318
678
1916
1979
539
342
5
886
570
326
896
1782
1980
539
253
9
801
459
388
847
1648
1981
784
429
28
1241
454
292
746
1986
1982
568
260
5
833
591
336
927
1760
1983
751
373
36
1160
758
439
1197
2357
1984
330
257
42
629
481
368
849
1477
1985
340
234
17
591
113
164
277
868
1986
72
51
0
123
0
0
0
123
1987-1990
0
0
0
0
0
0
0
0
1991
528
159
20
707
31
195
226
933
1992
620
247
24
891
73
159
232
1123
1993
402
170
14
586
0
0
0
586
1994-1996
0
0
0
0
0
0
0
0
1997
0
0
0
0
0
1
1
1
1998
0
2
0
2
0
1
1
3
1999
50
33
0
83
0
22
22
105
2000
279
94
8
381
0
29
29
410
2001
376
180
8
564
0
14
14
578
2002
398
228
17
643
0
16
16
659
2003
180
93
9
282
0
0
0
282
2004
0
0
0
0
0
0
0
0
2005
1
0
0
1
0
0
0
1
2006
0
0
0
0
0
0
0
0
2007
2
2
0
4
0
0
0
4
2008
5
5
0
10
0
2
0
12
2009
233
73
0
306
0
1
1
307
2010
246
77
0
323
0
0
0
323
2011
273
87
0
360
0
0
0
360
2012
228
68
0
296
0
0
0
296
2013
116
60
0
177
0
0
0
177
2014
40
26
0
66
0
0
0
66
2015
71
44
0
115
0
0
0
115
2016-2017
0
0
0
0
0
0
0
0
2018
129
66
0
195
0
0
0
195
2019-2021
0
0
0
0
0
0
0
0
2022
42
23
0
65
0
0
0
65
2023
38
23
0
61
Table 10.1. Barents Sea capelin. International catch (‘000 t) as used by the Working Group.
Length group (cm)
Age 3
Age 4
Age 5
Total
%
12.5-12.9
4.0
0.0
0
4
0.2
13.0-13.4
0.0
5.0
0
5
0.3
13.5-13.9
15.0
23.0
0
38
2.0
14.0-14.4
0.0
67.0
6
73
3.9
14.5-14.9
11.0
150.0
0
161
8.7
15.0-15.4
14.0
286.0
14
314
16.9
15.5-15.9
16.0
218.0
6
240
12.9
16.0-16.4
32.0
371.0
20
423
22.8
16.5-16.9
4.0
250.0
26
280
15.1
17.0-17.4
0.0
137.0
12
149
8.0
17.5-17.9
0.0
116.0
4
120
6.5
18.0-18.4
3.0
30.0
3
36
1.9
18.5-18.9
0.0
7.0
0
7
0.4
19.0-19.4
0.0
7.0
1
8
0.4
Total
99.0
1667.0
92
1858
%
5.3
89.7
5
100.0
Table 10.2a. Barents Sea capelin. Age-length distribution of Norwegian catch in 2023 (million individuals). Lengths in cm.
Length group (cm)
Age 2
Age 3
Age 4
Age 5
Total
%
9.0-9.9
3.6
0.0
0.0
0.0
3.6
0.3
10.0-10.9
3.7
0.0
0.0
0.0
3.7
0.3
11.0-11.9
6.0
6.0
0.0
0.0
12.0
0.9
12.0-12.9
0.0
13.3
0.0
0.0
13.3
1.0
13.0-13.9
0.0
69.3
53.3
0.0
122.7
8.8
14.0-14.9
0.0
101.6
298.8
3.0
403.3
28.9
15.0-15.9
0.0
39.4
300.8
0.0
340.2
24.4
16.0-16.9
0.0
28.0
300.0
3.3
331.3
23.7
17.0-17.9
0.0
3.6
111.9
3.6
119.1
8.5
18.0-18.9
0.0
0.0
23.6
0.0
23.6
1.7
19.0-19.9
0.0
0.0
23.6
0.0
23.6
1.7
Total
13.3
261.3
1111.9
9.9
1396.4
%
1.0
18.7
79.6
0.7
100.0
Table 10.2b. Barents Sea capelin. Age-length distribution of Russian catch in 2023 (million individuals). Lengths in cm.
Length (cm)
Age/year class
Sum (109)
Biomass (103 t)
Mean weight (g)
1
2
3
4
5
2022
2021
2020
2019
2018
6.5-7.0
0.173
0.173
0.197
1.14
7.0-7.5
1.053
0.168
1.220
1.732
1.42
7.5-8.0
2.935
0.197
3.132
6.226
1.99
8.0-8.5
7.824
0.821
8.645
19.166
2.22
8.5-9.0
10.031
0.441
10.472
28.753
2.75
9.0-9.5
11.895
0.343
12.239
38.300
3.13
9.5-10.0
15.166
0.100
15.266
58.947
3.86
10.0-10.5
15.113
0.237
15.350
66.819
4.35
10.5-11.0
14.850
0.210
15.060
75.302
5.00
11.0-11.5
14.627
2.217
16.844
96.126
5.71
11.5-12.0
9.244
11.066
1.106
21.416
142.779
6.67
12.0-12.5
2.476
14.645
8.525
0.120
25.766
190.014
7.37
12.5-13.0
2.061
20.894
15.808
0.451
39.214
319.756
8.15
13.0-13.5
0.534
10.955
16.114
1.694
29.297
284.996
9.73
13.5-14.0
0.449
7.195
20.654
1.733
30.031
336.677
11.21
14.0-14.5
0.077
2.821
11.868
1.824
16.590
210.570
12.69
14.5-15.0
4.040
13.968
4.695
0.026
22.728
326.778
14.38
15.0-15.5
1.427
7.052
2.905
11.384
188.548
16.56
15.5-16.0
0.834
3.502
2.346
0.050
6.732
124.438
18.48
16.0-16.5
1.263
5.046
3.908
0.078
10.296
212.606
20.65
16.5-17.0
0.323
2.099
1.609
0.046
4.077
98.024
24.05
17.0-17.5
0.087
0.974
1.431
2.492
67.225
26.98
17.5-18.0
0.409
0.789
1.198
35.026
29.23
18.0-18.5
0.214
0.271
0.484
15.342
31.68
18.5-19.0
0.094
0.085
0.179
6.115
34.13
19.0-19.5
0.030
0.030
1.219
41.00
TSN (109)
108.509
80.283
107.433
23.890
0.200
320.315
TSB (103 t)
480.567
723.410
1324.193
419.405
4.103
2951.679
Mean length (cm)
9.90
12.58
13.73
15.08
15.80
Mean weight (g)
4.43
9.01
12.33
17.56
20.51
9.21
SSN (109)
0.077
10.794
45.226
19.893
0.200
76.190
SSB (103 t)
0.982
169.123
735.870
375.882
4.018
1285.890
Table 10.3. Barents Sea capelin. Stock size estimation table. Estimated stock size (109) by age and length, and biomass (1000 tonnes) from the acoustic survey in August-October 2023. TSN: Total stock number. TSB: Total stock biomass. MSN: Maturing stock number. MSB: Maturing stock biomass.
Year
Stock in numbers (109)
Biomass (103 tonnes)
Age 1
Age 2
Age 3
Age 4
Age 5
Total
Total
MSB
1973
528
375
40
17
0
961
5144
1350
1974
305
547
173
3
0
1029
5733
907
1975
190
348
296
86
0
921
7806
2916
1976
211
233
163
77
12
696
6417
3200
1977
360
175
99
40
7
681
4796
2676
1978
84
392
76
9
1
561
4247
1402
1979
12
333
114
5
0
464
4162
1227
1980
270
196
155
33
0
654
6715
3913
1981
403
195
48
14
0
660
3895
1551
1982
528
148
57
2
0
735
3779
1591
1983
515
200
38
0
0
754
4230
1329
1984
155
187
48
3
0
393
2964
1208
1985
39
48
21
1
0
109
860
285
1986
6
5
3
0
0
14
120
65
1987
38
2
0
0
0
39
101
17
1988
21
29
0
0
0
50
428
200
1989
189
18
3
0
0
209
864
175
1990
700
178
16
0
0
894
5831
2617
1991
402
580
33
1
0
1016
7287
2248
1992
351
196
129
1
0
678
5150
2228
1993
2
53
17
2
2
75
796
330
1994
20
3
4
0
0
28
200
94
1995
7
8
2
0
0
17
193
118
1996
82
12
2
0
0
96
503
248
1997
99
39
2
0
0
140
911
312
1998
179
73
11
1
0
263
2056
931
1999
156
101
27
1
0
285
2776
1718
2000
449
111
34
1
0
595
4273
2099
2001
114
219
31
1
0
364
3630
2019
2002
60
91
50
1
0
201
2210
1290
2003
82
10
11
1
0
104
533
280
2004
61
17
4
1
0
83
513
224
2005
17
21
3
0
0
42
487
348
2006
51
17
5
0
0
73
636
348
2007
195
50
6
0
0
251
1816
846
2008
289
198
24
0
0
512
3950
2185
2009
172
149
48
0
0
368
3247
1892
2010
242
137
67
2
0
448
3824
2248
2011
194
173
58
8
0
433
3604
2059
2012
175
117
88
3
0
383
3457
1996
2013
321
197
68
12
0
598
3973
1725
2014
103
81
37
2
0
223
1689
785
2015
39
42
13
1
0
95
882
434
2016
33
8
2
0
0
43
317
153
2017
115
119
14
0
0
249
2428
1547
2018
59
61
22
0
0
142
1641
1100
2019
18
10
7
1
0
36
413
302
2020
370
31
4
1
0
406
1890
542
2021
222
326
7
0
0
556
3986
1459
2022*
75
136
58
1
0
270
2174
817
2023
109
80
107
24
0
320
2958
1286
Table 10.4. Barents Sea capelin. Stock size in numbers by age, total stock biomass, biomass of the maturing component (MSB) at 1. October. The stock numbers for 2004-2021 are updated following the data evaluation workshop in 2021, and the subsequent WKCAPELIN benchmark in 2022. The comparison with previous estimates is presented in detail in Annex 3 number BS0 in the WKCAPELIN benchmark report (ICES, 2023).
*Not adjusted for incomplete area coverage
Year
CV age 1
CV age 2
CV age 3
CV age 4
2004
0.253
0.235
0.225
0.513
2005
0.319
0.332
0.375
0.508
2006
0.301
0.240
0.344
0.705
2007
0.197
0.232
0.331
0.665
2008
0.228
0.198
0.302
0.634
2009
0.455
0.370
0.453
1.680
2010
0.163
0.224
0.199
0.288
2011
0.231
0.205
0.276
0.463
2012
0.210
0.314
0.335
0.605
2013
0.132
0.127
0.138
0.267
2014
0.237
0.213
0.237
0.331
2015
0.235
0.252
0.234
0.364
2016
0.167
0.237
0.305
0.491
2017
0.182
0.099
0.123
0.407
2018
0.288
0.255
0.276
0.441
2019
0.138
0.322
0.355
0.405
2020
0.241
0.269
0.338
0.501
2021
0.168
0.102
0.299
1.301
2022
2023
0.280
0.170
0.170
0.200
Table 10.5. Barents Sea capelin. CV by age group of the acoustic estimates shown in Table 10.4, for the period 2004-2023. The CV estimates for 2022 are not included due to the poor survey coverage.
Figure 10.1. Survey coverage and geographical distribution of acoustic recordings of capelin in autumn 2023. The size of the circles corresponds to nautical acoustic scattering coefficient (NASC; m2/nmi2) per 1 nautical mile. Gray dots mark transects or transect sections without capelin recordings.
Figure 10.2. Weight-at-age (grams) for capelin from the autumn survey.
Figure 10.3. Survey mortality by survey year. Survey mortality is calculated as -log((Ntotal at age a+1 in year y+1 + catch of immatures in year y and year y+1)/Nimmatures at age a in year y). Capelin >14 cm are assumed to be maturing.
Figure 10.4. Probabilistic prognosis 1 October 2023—1 April 2024 for Barents Sea capelin maturing stock, with a catch of 0 tonnes (upper panel) and 196 000 tonnes (lower panel). Yellow line shows median, red area shows 25-75 percentiles and green area 5-95 percentiles. The prognosis is based on 50000 simulations.
Figure 10.5. Probability of SSB 2024 < 200 000 tonnes as a function of the catch. Calculated for each 10 kt.
Figure 10.6. Capelin in subareas 1 and 2, excluding Division 2a west of 5°W (Barents Sea capelin). Catch, recruitment and summary of stock assessment (mature and immature stock biomass October 1 and SSB April 1 in tonnes). The 2022 estimate of maturing and immature stock biomass has not been corrected for incomplete survey coverage.