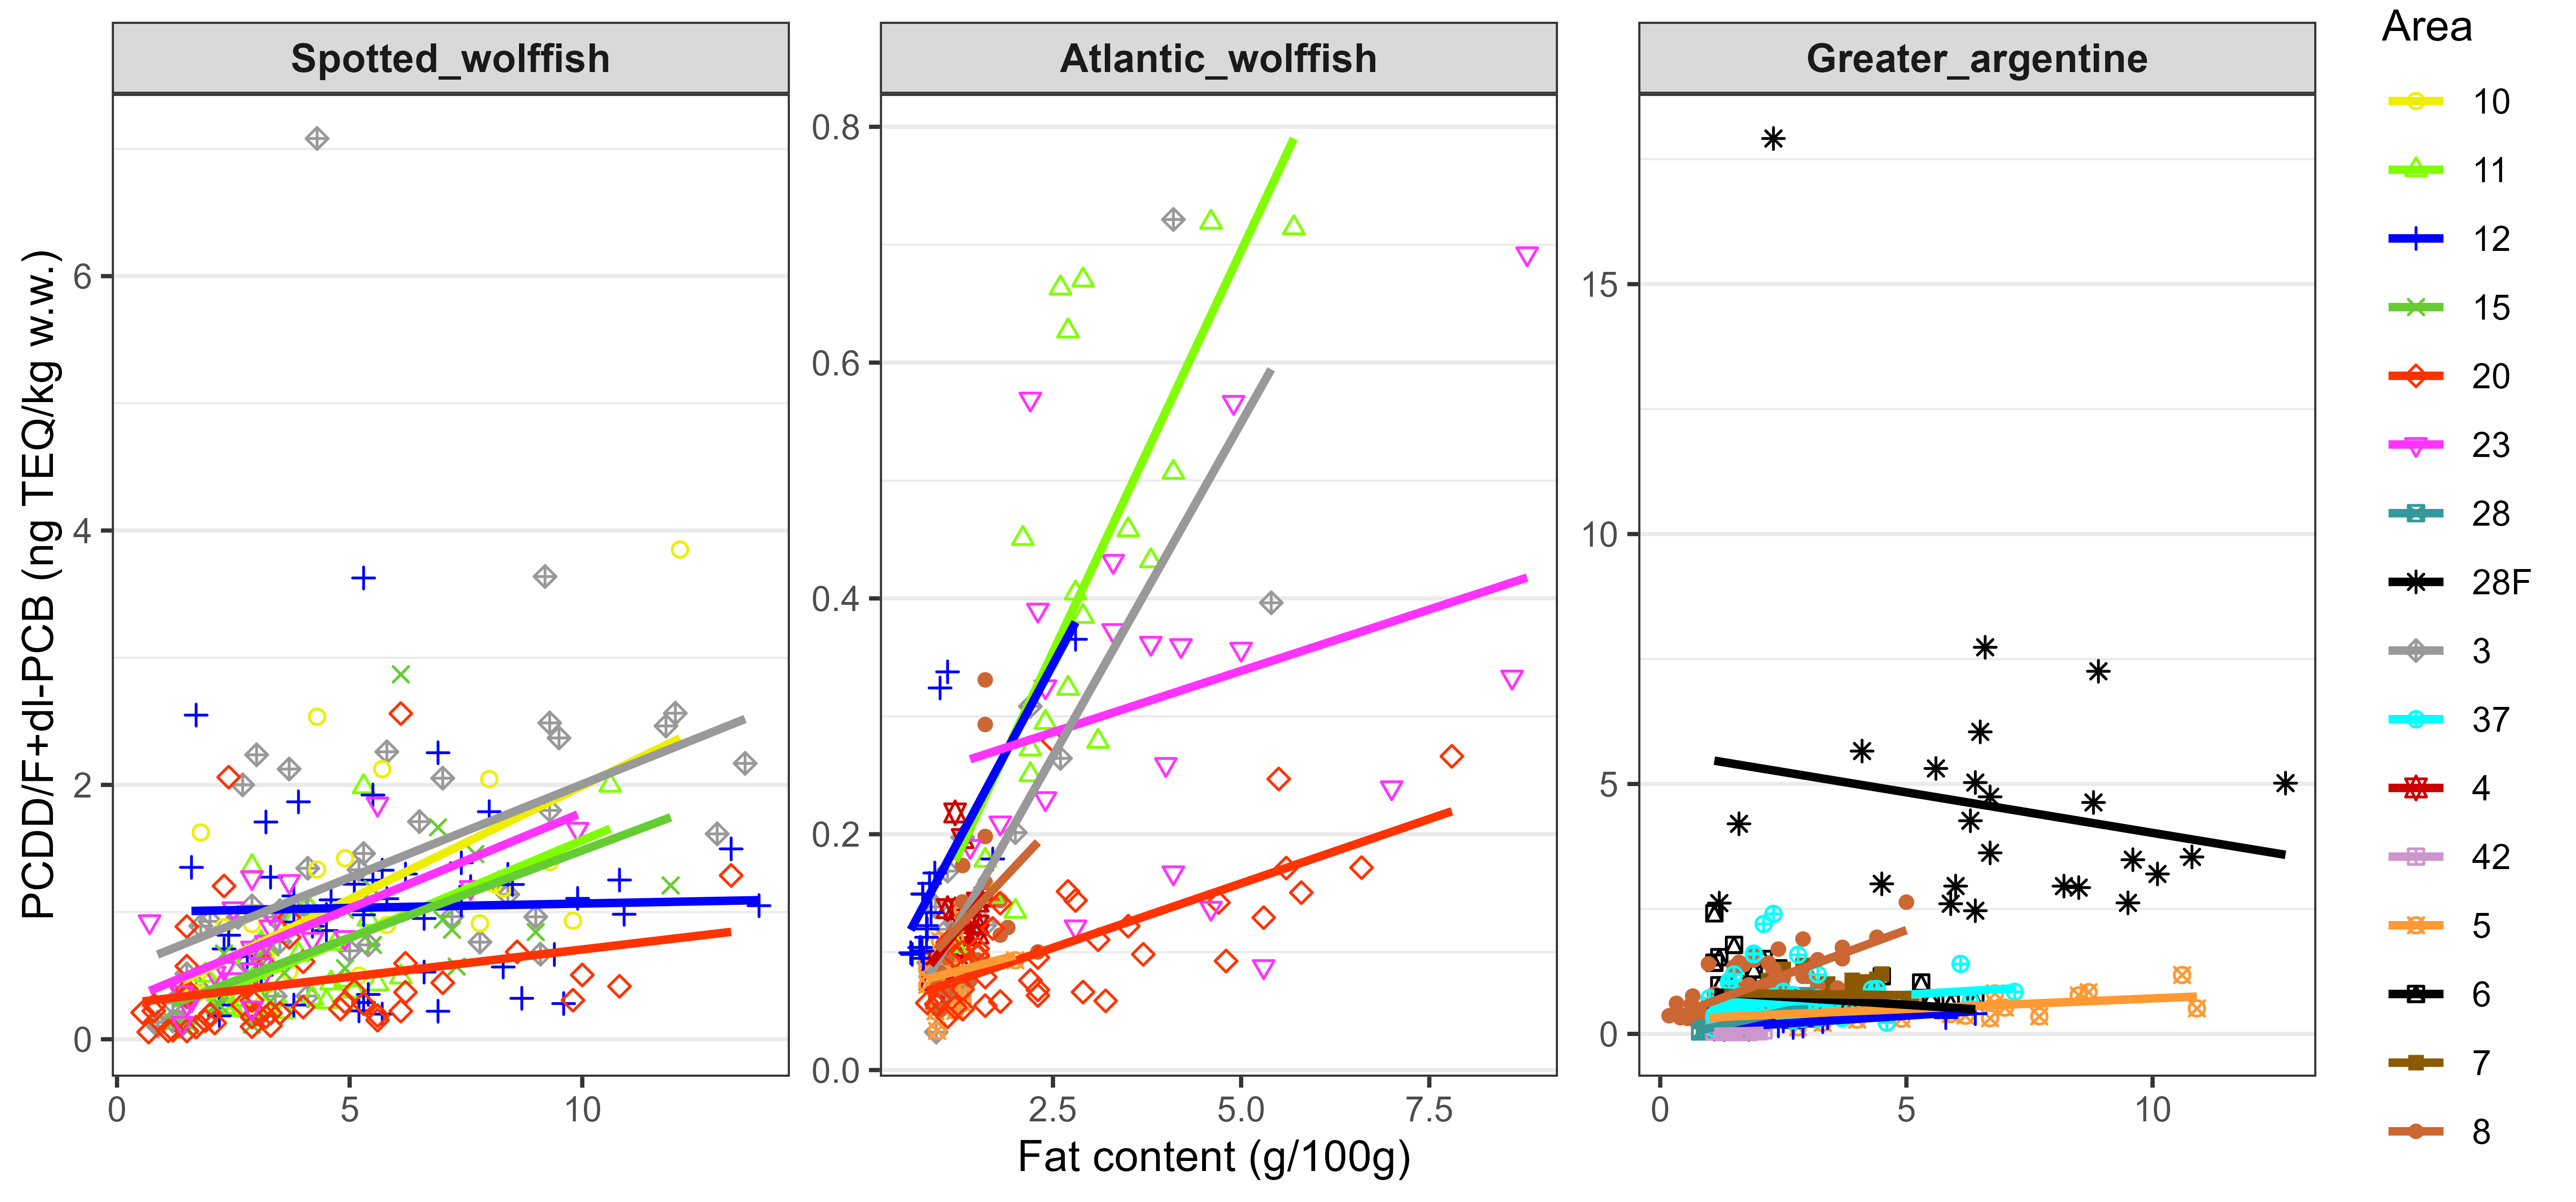
Figure 14. Concentration of sum PCDD/F+dl-PCB (ng TEQ/kg wet weight) in fillet of spotted wolffish, Atlantic wolffish and greater argentine versus fat content at the different sampling stations (statistics areas). The different areas are marked by different colours and symbols. The straight lines indicate the linear regression with fat content for each station/area.on