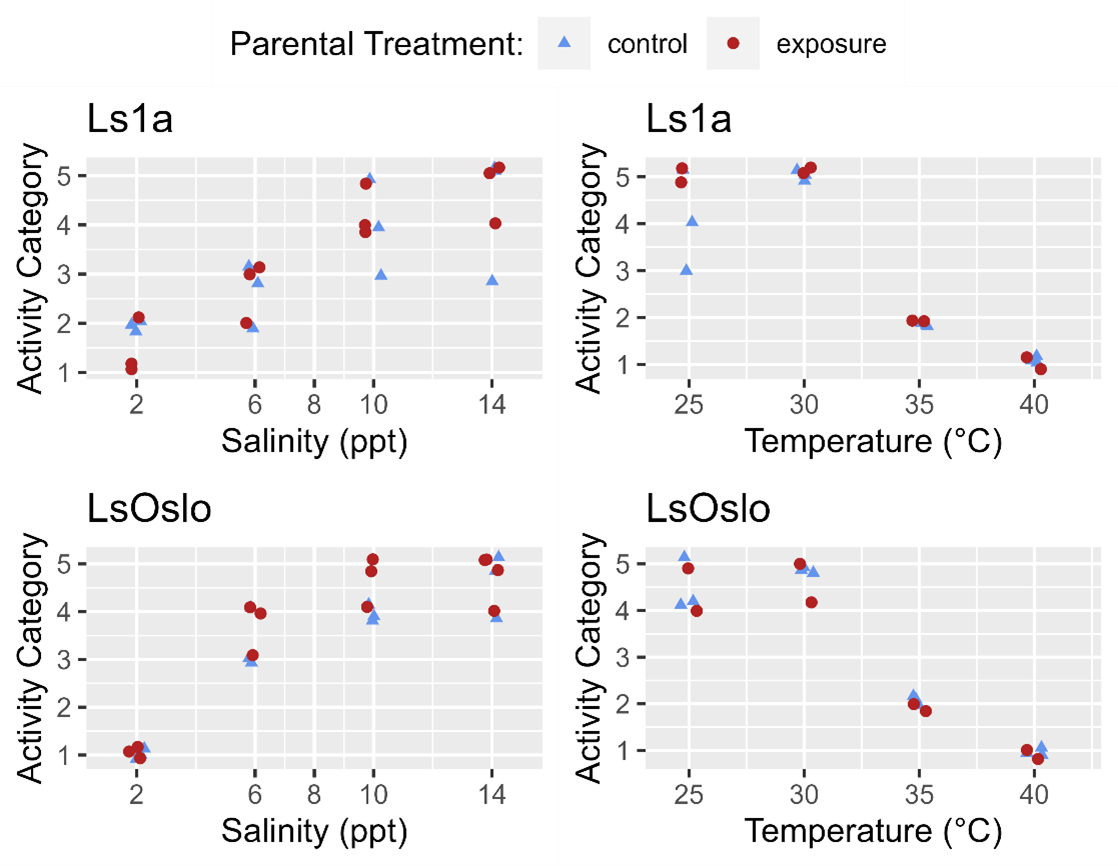
Fig. 22. Activity of copepodids as a function of salinity (exposures lasting 120 minutes) and temperature (exposures lasting 10 minutes). The copepods are offspring of a parental generation that was either in a control treatment, or treated with an exposure of low salinity or high temperature. The LsOslo and Ls1a strains are separated by subplot along with temperature and salinity. Each subplot shows the observed activity category of the copepods for the exposure level, with the generations indicated by marker shape and color. To better show overlapping data points a jittered was applied by up to 0.2 of an activity category, 0.3 of a salinity ppt, and 0.4 of a °C. The exposure levels tried in the experiments are indicated as those with labeled x-axis ticks.