Gå til hovedinnhold
Havforskningsinstituttet
HI
English
<- Tilbake
Søk
Søk
Søk
View page in English
Figur
Fra rapporten:
North Sea Ecosystem Cruise ReportJH2022206
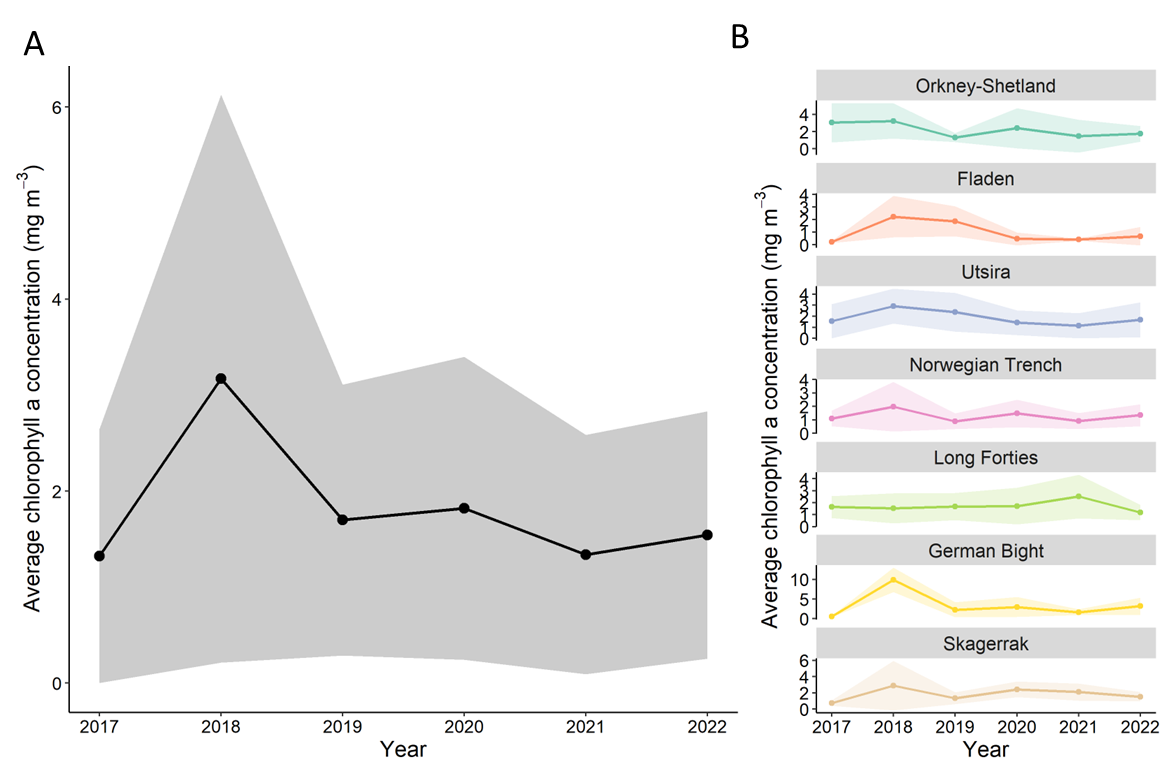
Figure 14. Timeseries of North Sea Spring surface chlorophyll a concentration. A) Average chlorophyll a concentration across the entire North Sea. B) Average chlorophyll concentrations in WGINOSE sub-regions. Shading represents standard deviation.