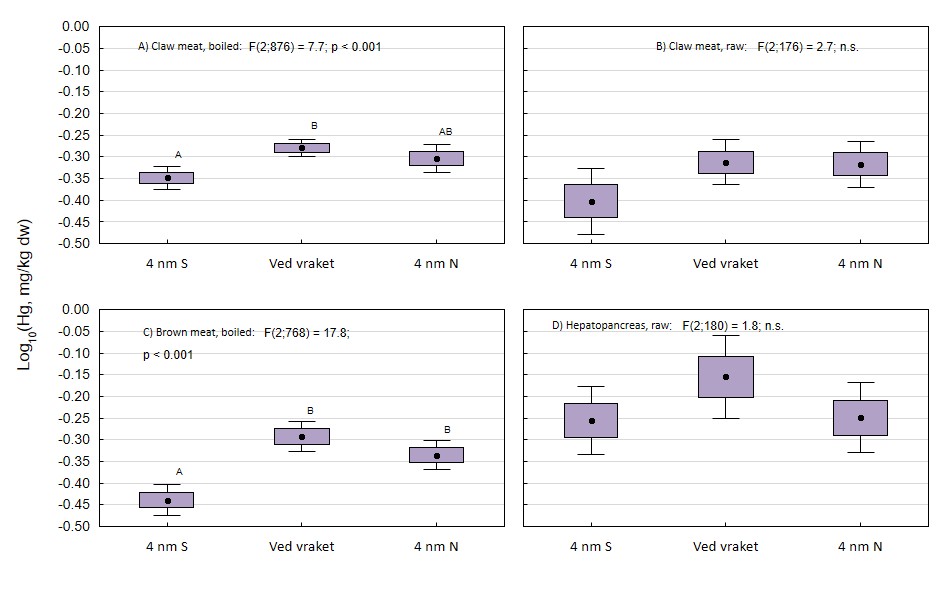
Figure 5. Total mercury concentration on dry weight (Hg, mg/kg dw) in crab (Cancer pagurus) caught at the wreck of U-864 (U-864), four nautical miles north of the wreck (4 nm N) and four nautical miles south of the wreck (4 nm S) during 2006-2020. Results are given for A) claw meat of boiled crab, B) claw meat of raw crab, C) brown meat of boiled crab and D) hepatopancreas of raw crab. Boxplots show mean, standard error and 96% confidence intervals of log 10 transformed values. Results of one-way ANOVA is given with significance level of 95%. Different letters above the boxes indicate significant differences between groups (Tukey HSD).