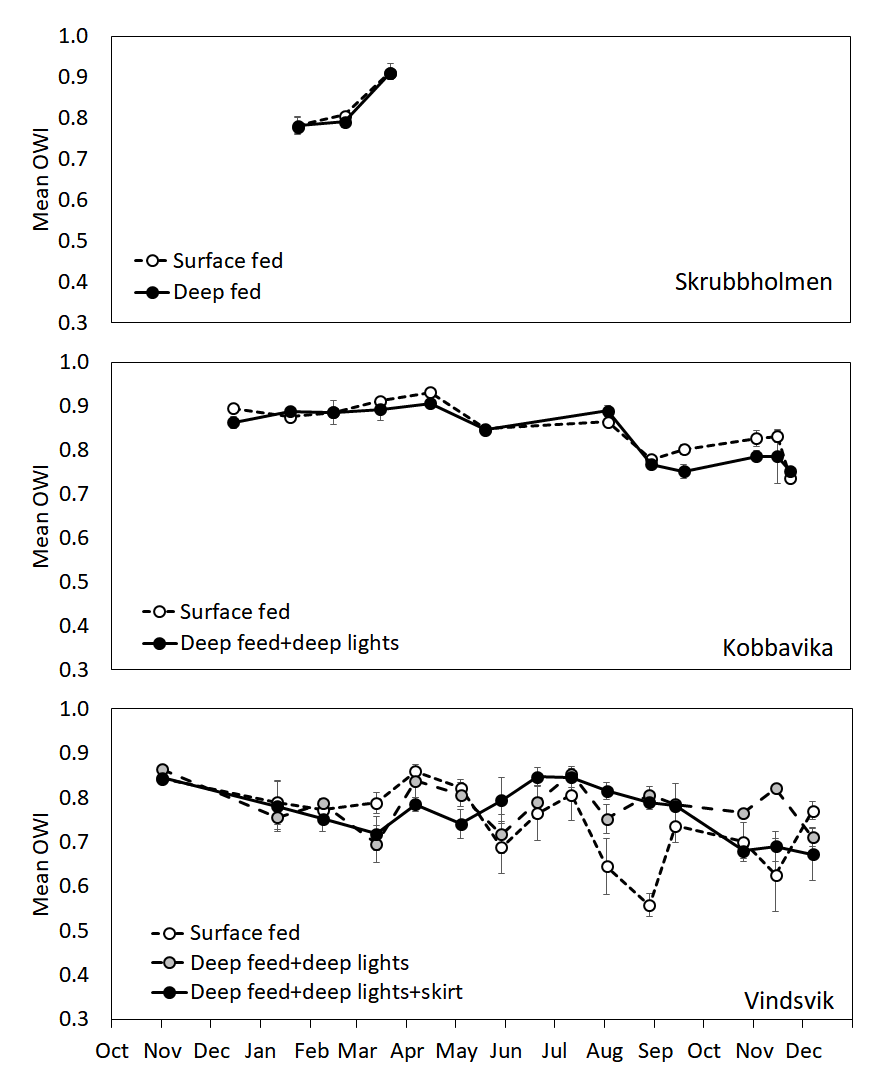
Figure
3. Mean
overall welfare score of fish in treatment groups, for each study
site, over the study period. Periods differ in year between sites:
Kobbavika shows data from 2015-2016, Vindsvik from 2016-2017, and
Skrubbholmen within 2018. The overall welfare index is calculated
using the SWIM model (Stien et al. 2013), which has a possible score
range from 0 to the most positive score of 1.