Figure
11.
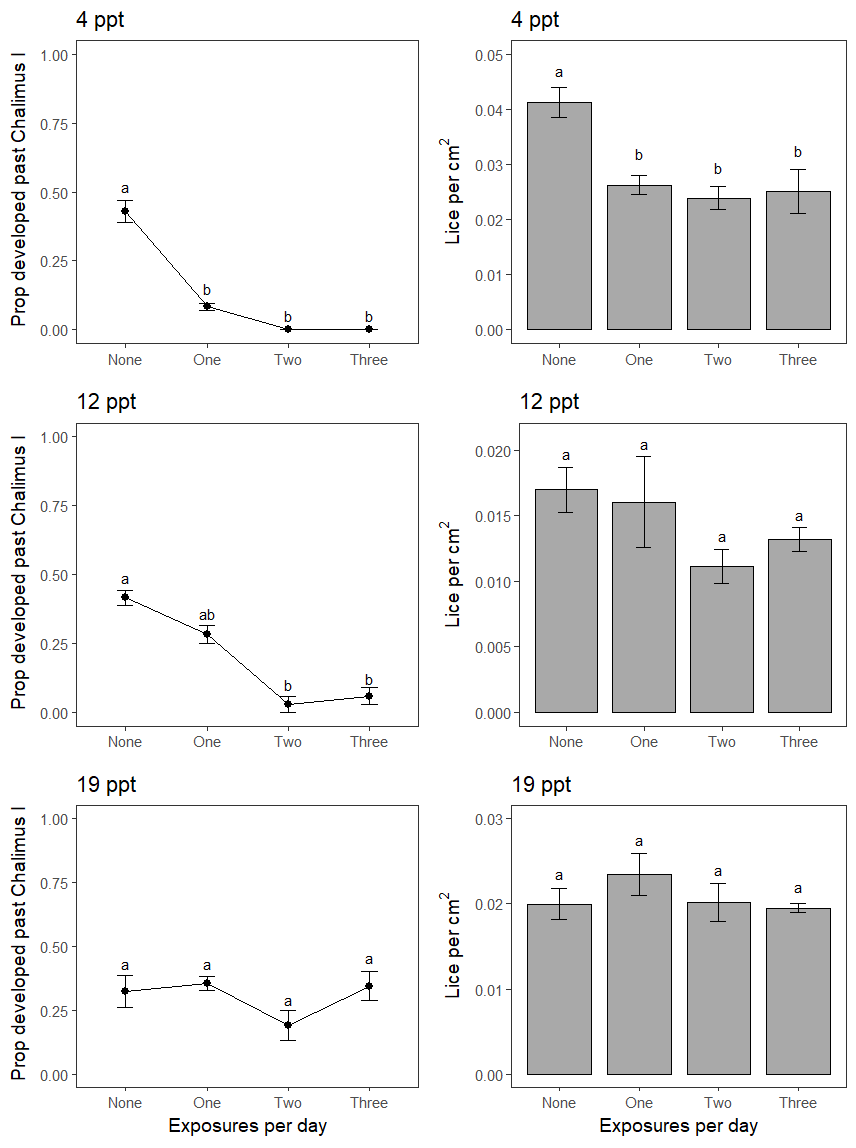
Development and survival of lice following repeated exposure to
brackish water at 4, 12 and 19 ppt for 1 hour once, twice or thrice
per day for three consecutive days. Mean ± SE values are displayed,
and different letters indicate statistically significant differences
at alpha = 0.05. Note the differing y-axis values.