Figure
3.
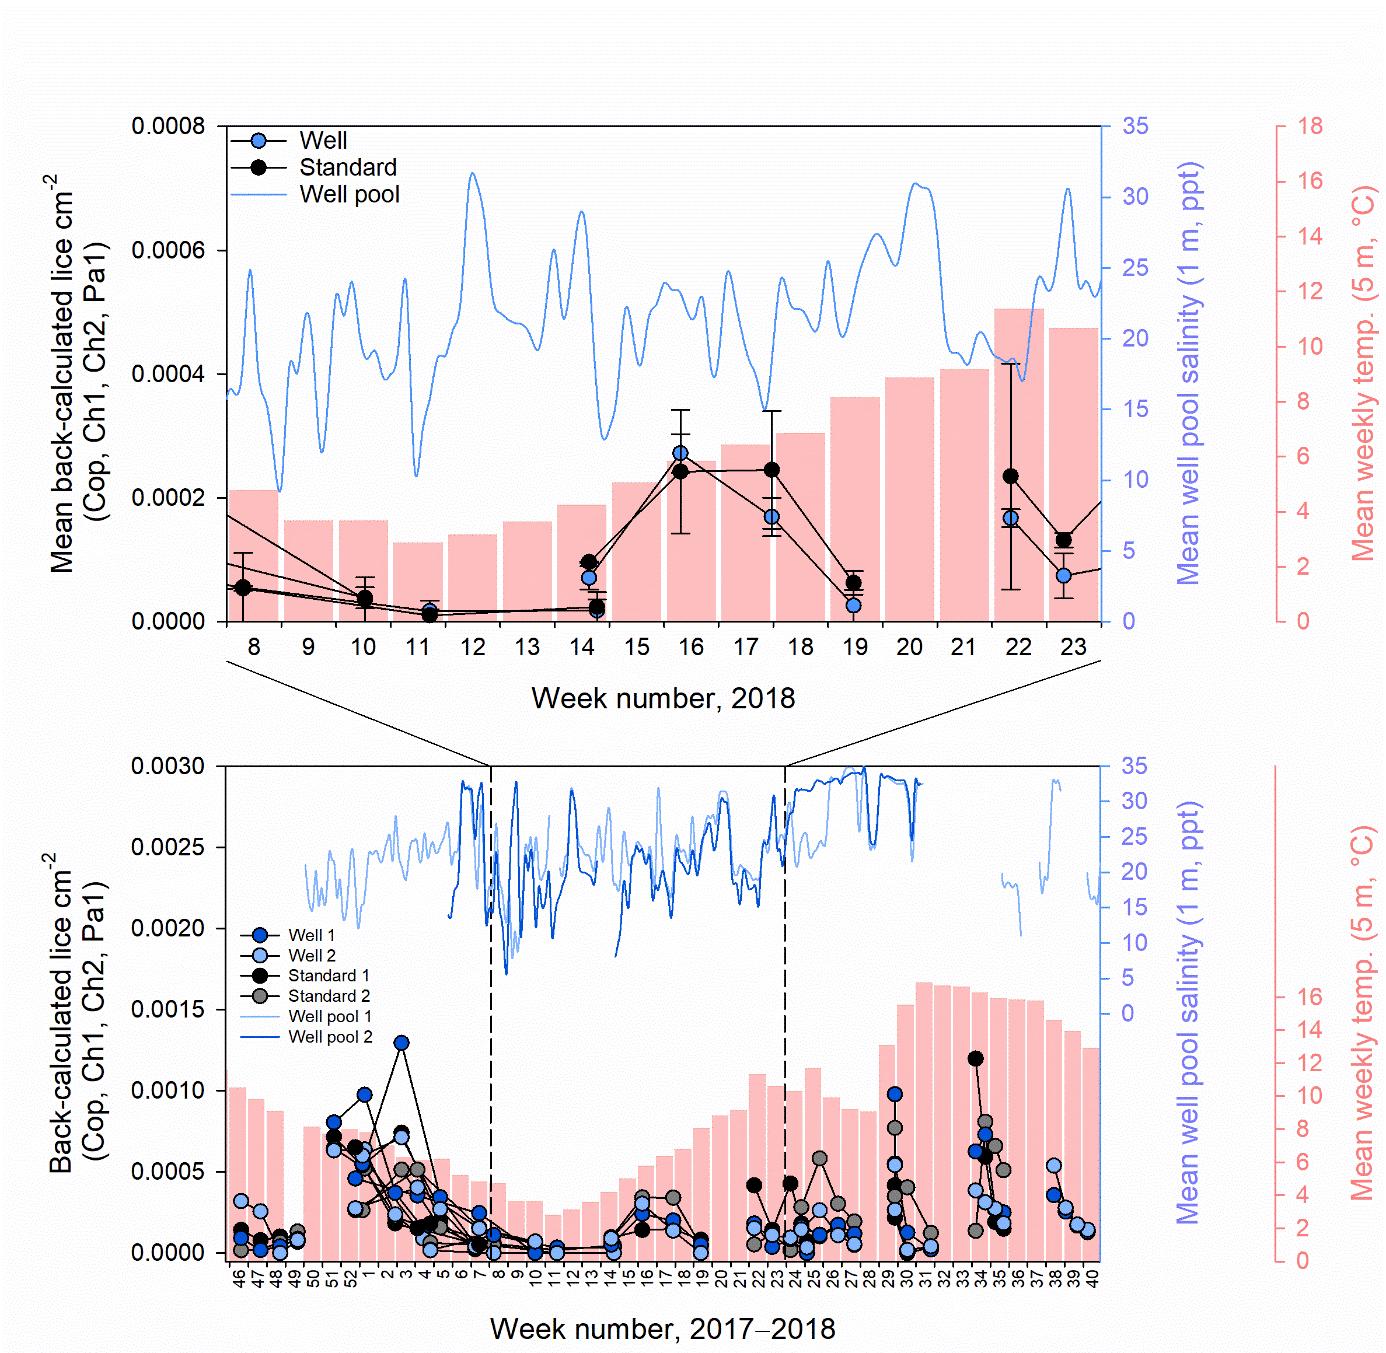
In the bottom plot, numbers of copepodid (Cop), chalimus 1 (Ch1),
chalimus 2 (Ch2) and preadult 1 (Pa1) lice stages are plotted against
back-calculated times of attachment based on their development at the
weekly 5 m depth water temperature recorded at Haverøy (pink bars)
during the well cage trial. Lice data points are shaded according to
cage type (light and dark blue circles for well cages, grey and black
circles for standard skirt cages) and black lines between them join
lice stages recorded at the same sampling point. Light and dark blue
lines indicate the mean daily salinity inside the freshwater lens
pools of the two well cages. The interval between the dotted lines in
the bottom plot and in the top plot, was set as the defined study
period, wherein all skirts were deployed and freshwater lens pools in
both well cages were fully functioning. Here, mean ± SE lice numbers
for each cage type (blue and black for well and standard skirt cages,
respectively) and mean salinities in both freshwater lens pools of
well cages are presented (blue line). Note that y axis scales differ.