Gå til hovedinnhold
Havforskningsinstituttet
HI
English
<- Tilbake
Søk
Søk
Søk
View page in English
Figur
Fra rapporten:
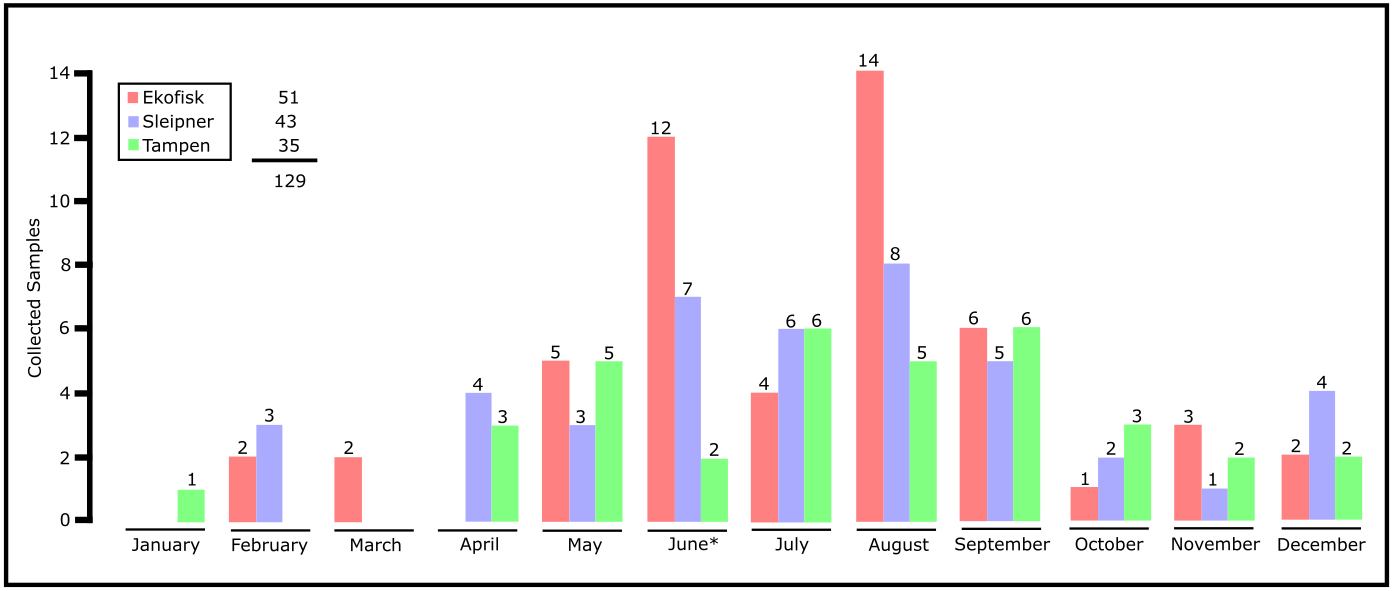
Mapping of fish spawning in the North Sea
Figure A1. Distribution of the samples collected each month per sampling site throughout the year.