Gå til hovedinnhold
Havforskningsinstituttet
HI
English
<- Tilbake
Søk
Søk
Søk
View page in English
Figur
Fra rapporten:
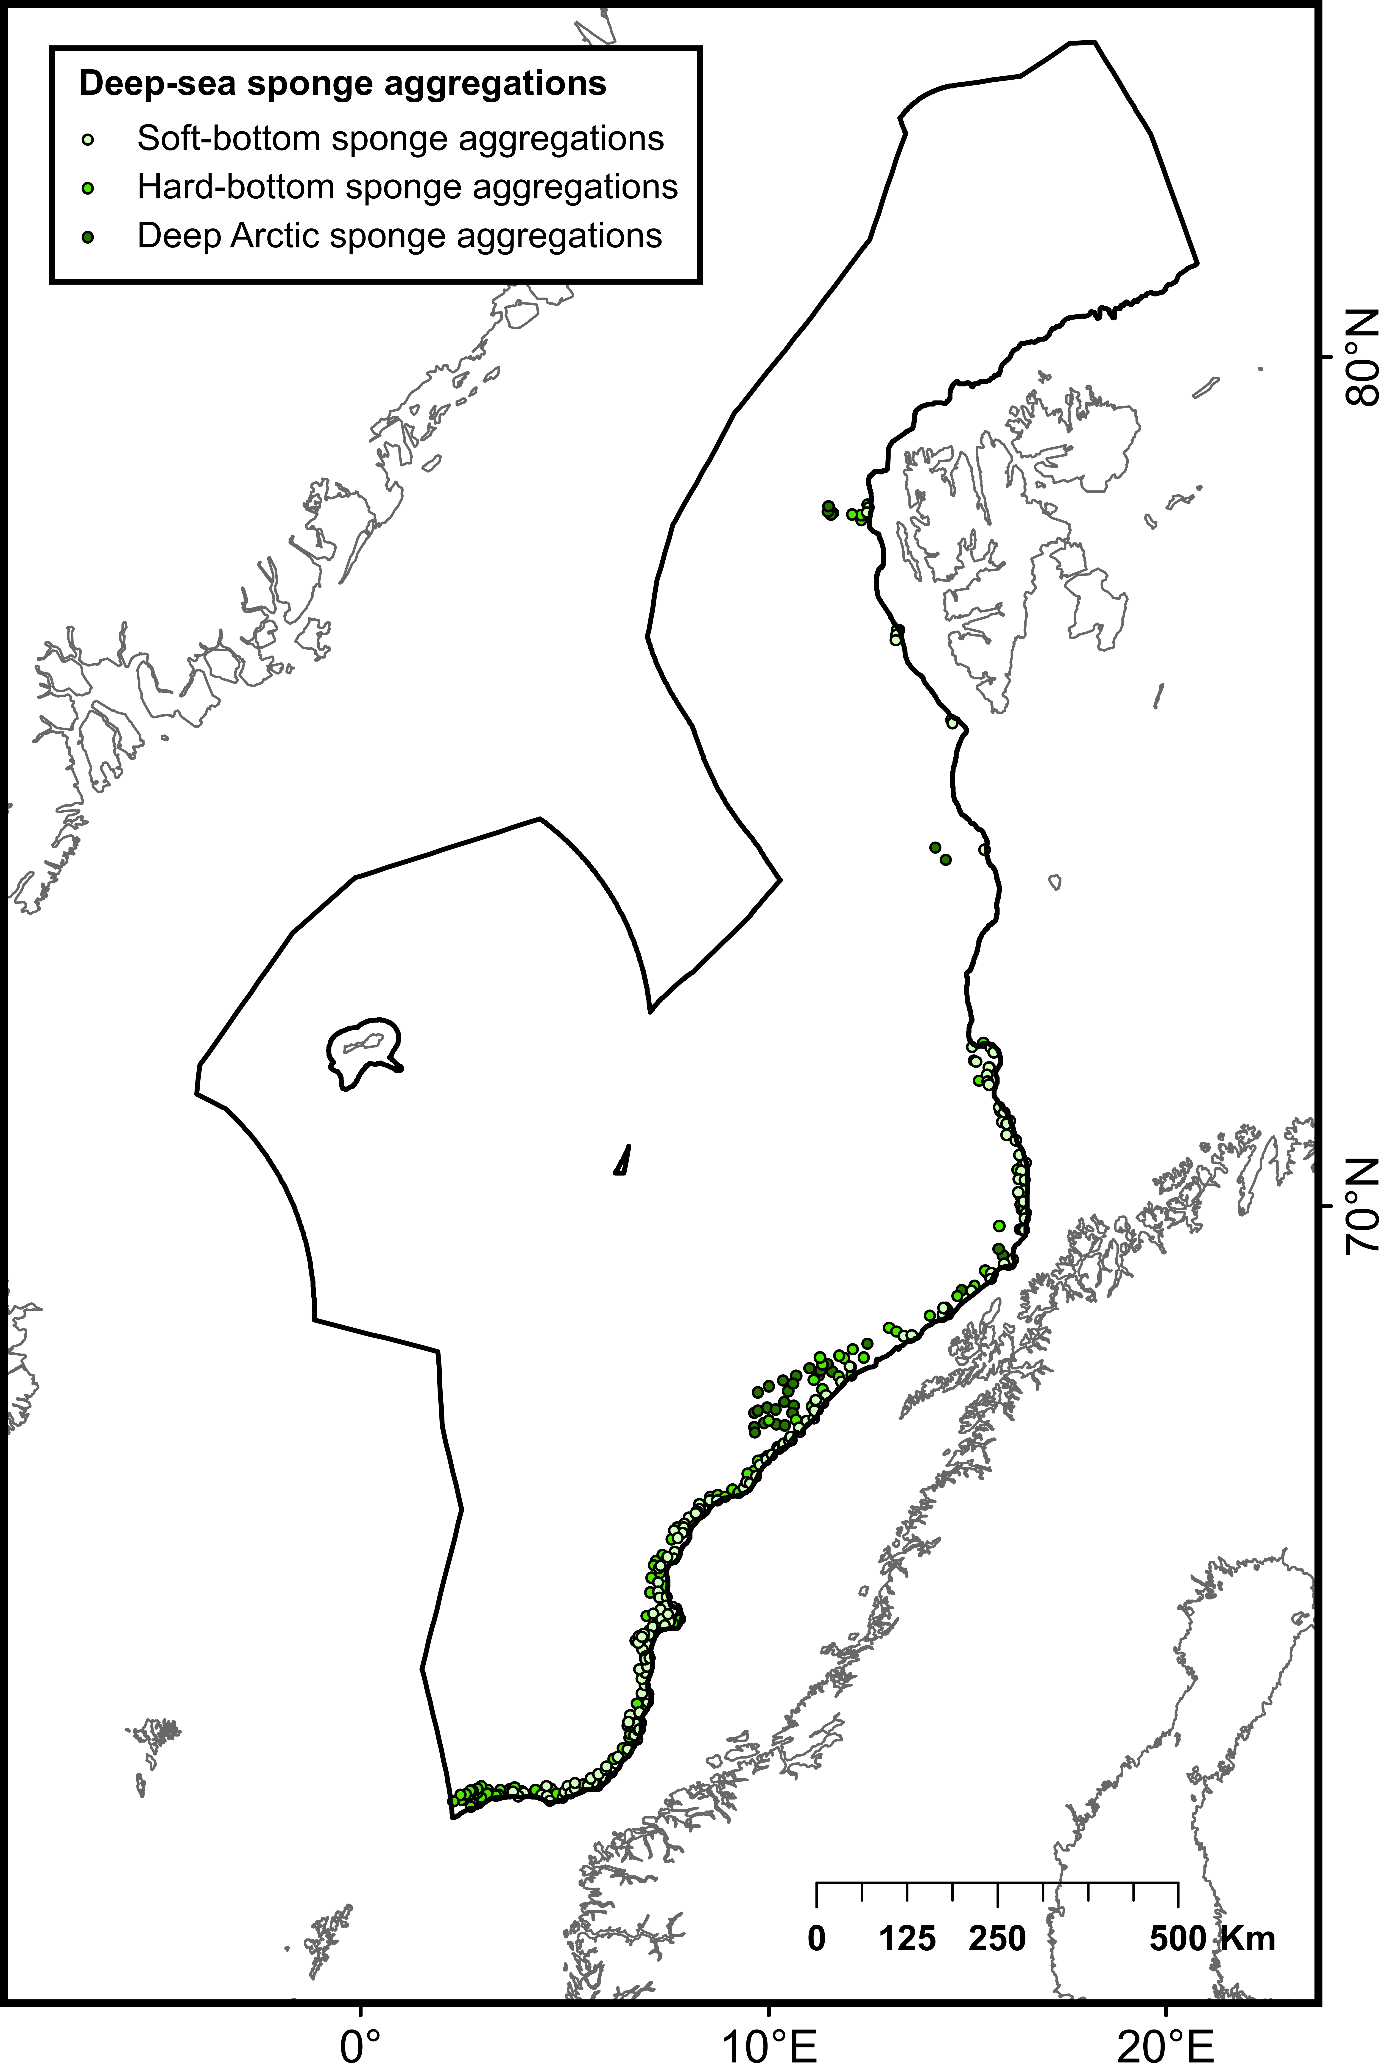
Identifying priorities for the protection of deep-sea species and habitats in the Nordic Seas
Appendix 8: Map showing the distribution of the stations where deep-sea sponge aggregations were observed in the study area. Data from the Institute of Marine Research (MAREANO).