Gå til hovedinnhold
Havforskningsinstituttet
HI
English
<- Tilbake
Søk
Søk
Søk
View page in English
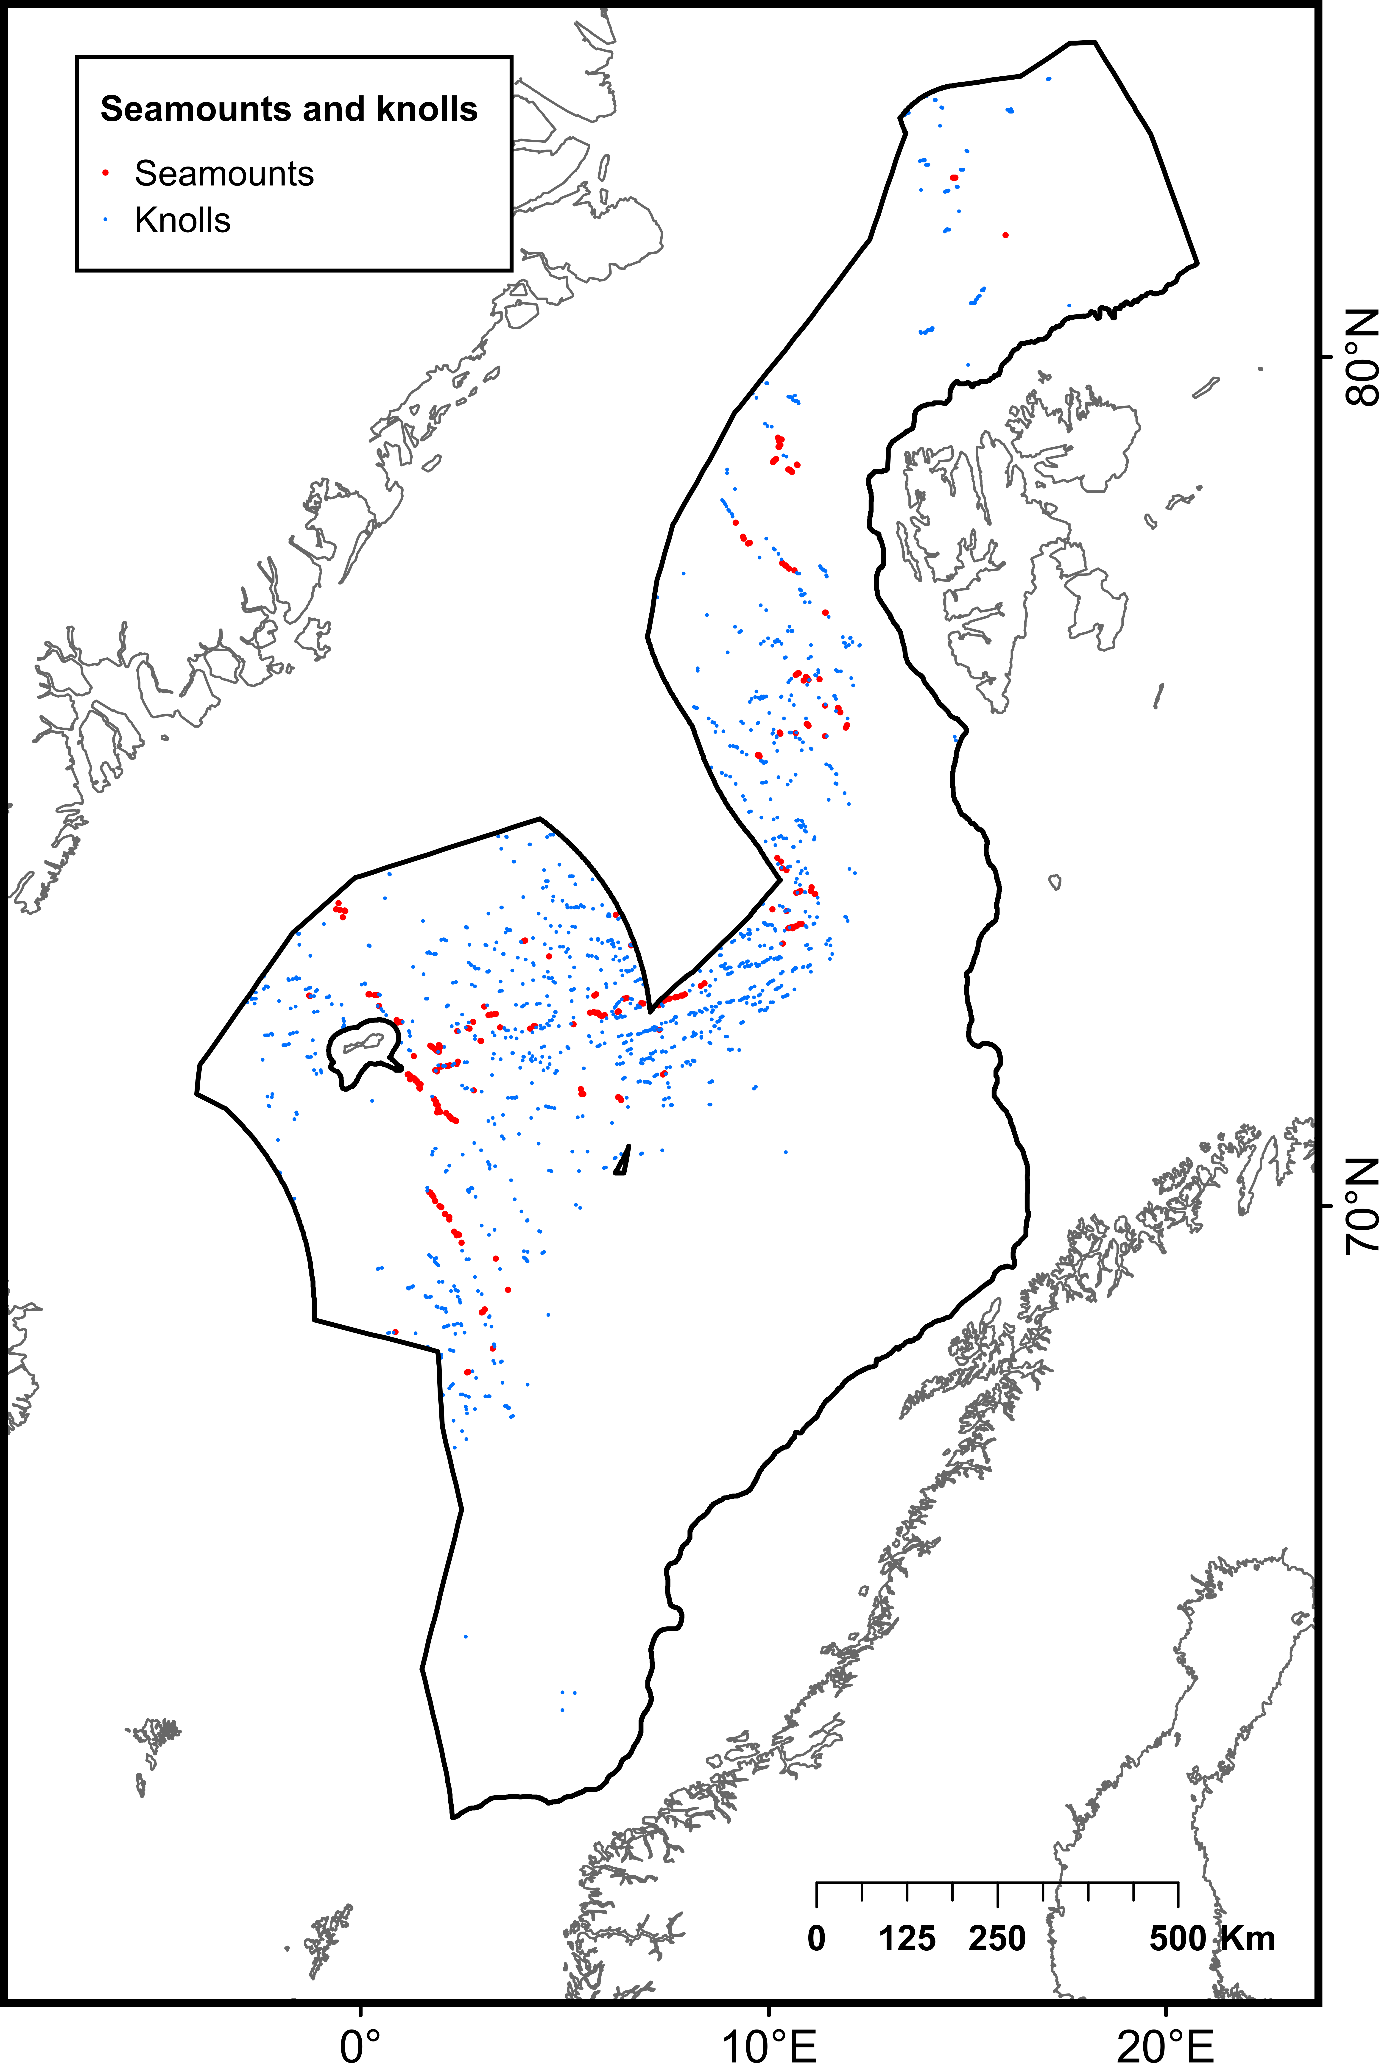
Figur
Fra rapporten:
Identifying priorities for the protection of deep-sea species and habitats in the Nordic Seas
Appendix 5: Map of the distribution of seamounts and knolls in the study area65.