Gå til hovedinnhold
Havforskningsinstituttet
HI
English
<- Tilbake
Søk
Søk
Søk
View page in English
Figur
Fra rapporten:
Identifying priorities for the protection of deep-sea species and habitats in the Nordic Seas
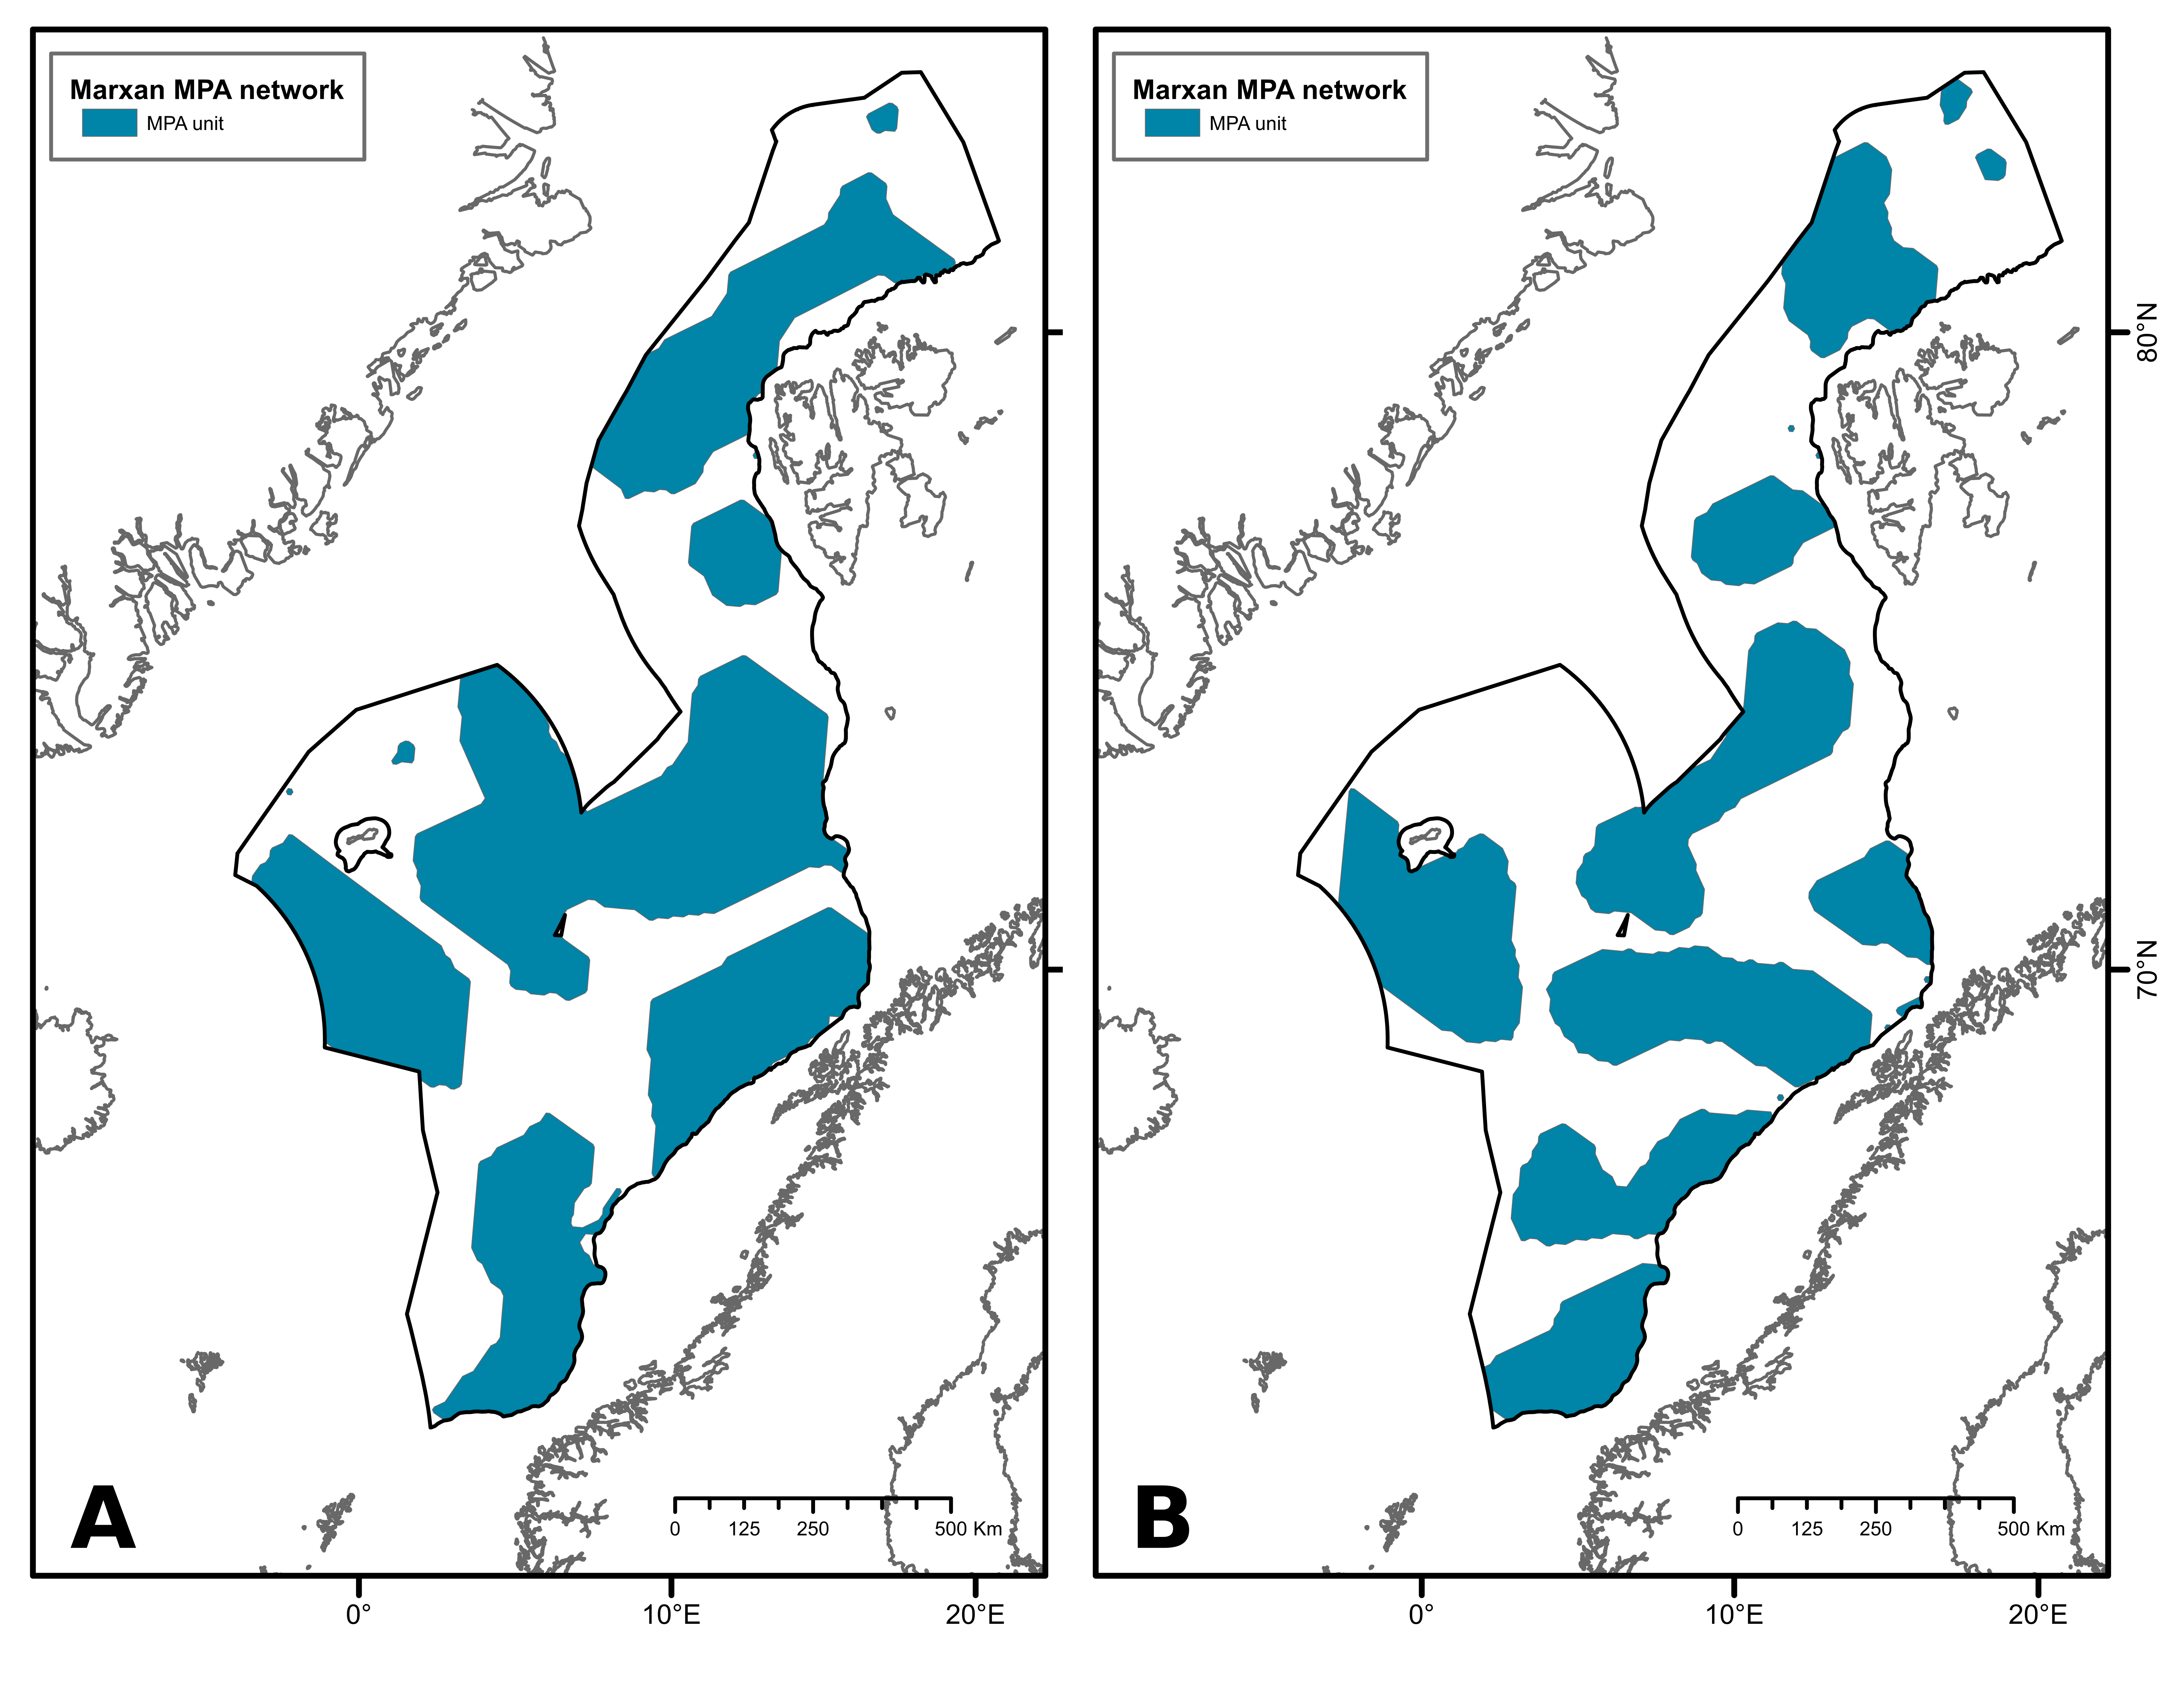
Figure 3. Selection of two different scenarios of MPA networks protecting A (left): 50% and B (right): 40% of the total study area.