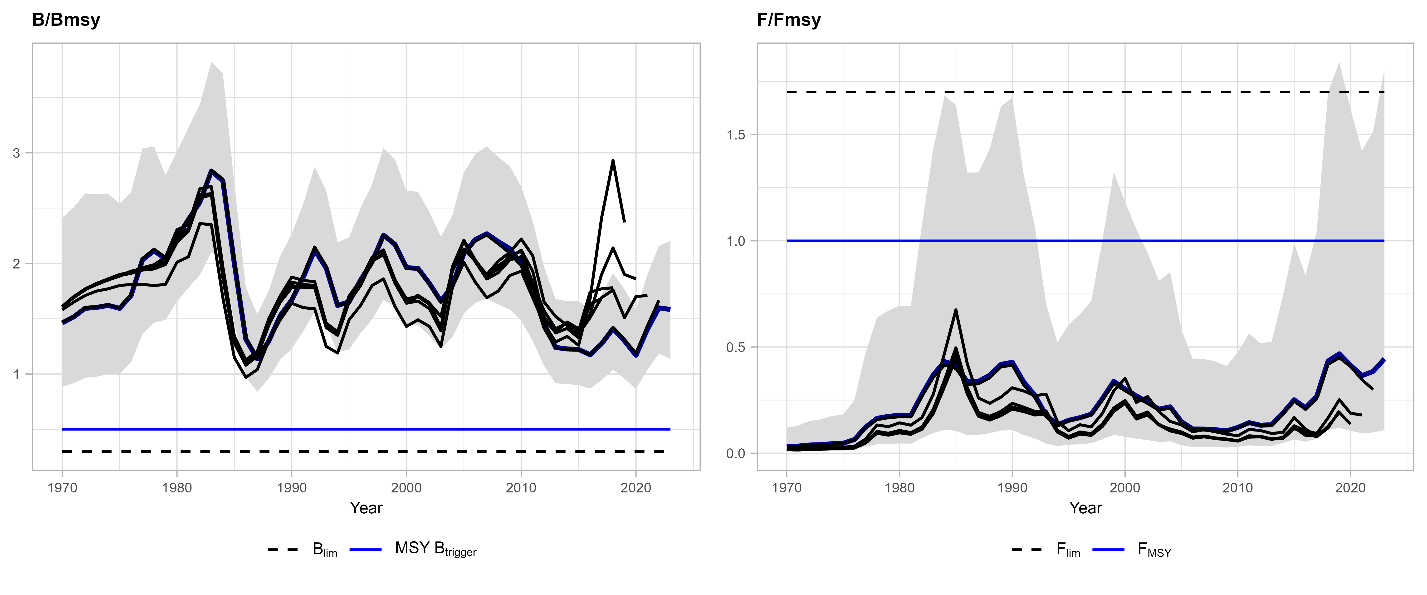
Figure 2: Northern shrimp in subareas 1 and 2. Historical assessment results. Black lines show B/B MSY and F/ F MSY trends as assessed in prior years, dark-blue lines the current assessment, and shaded areas the 95% confidence intervals of the current assessment. The stock assessment has undergone revisions during a benchmark in 2022.