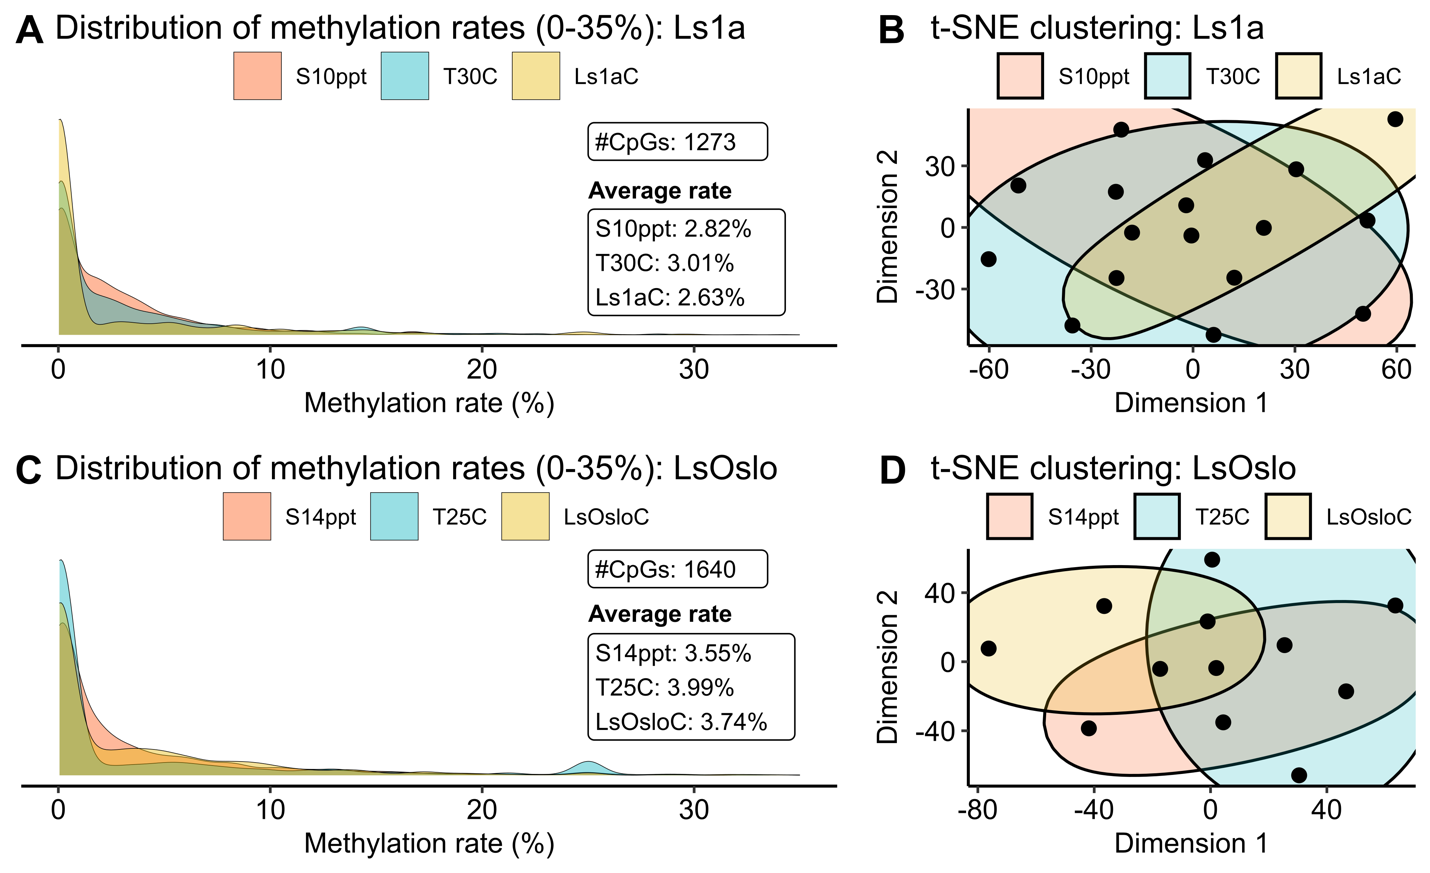
Fig. 25. Distributions and clustering analysis of methylated CpG sites. (A) and (C): Two ridge density plots showing the distributions of methylation rates for salinity and temperature treatment groups and control groups, for Ls1A and LsOslofjord (LsOslo), respectively. (B) and (D): two t-distributed stochastic neighbor embedding (t-SNE) plots showing the results of clustering analysis using 1273 and 1640 CpG sites for Ls1A and LsOslofjord, respectively.