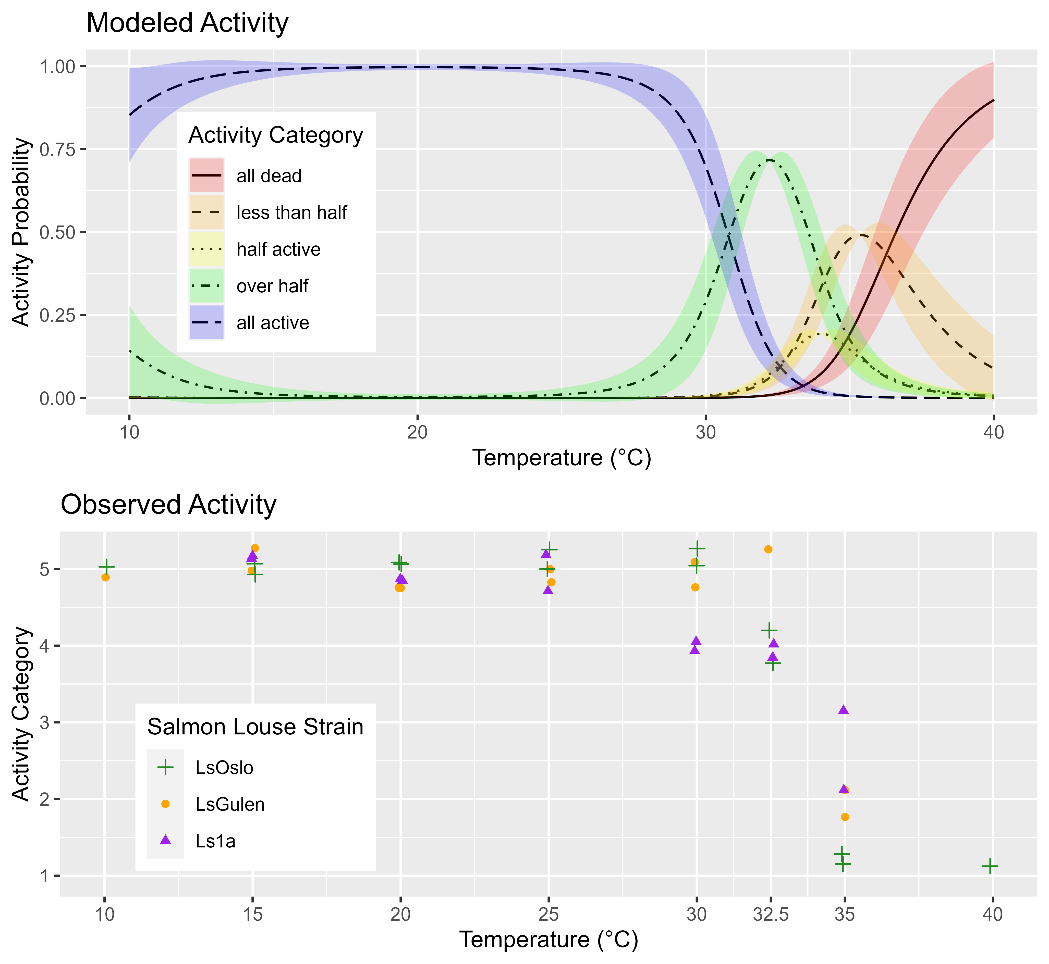
Fig. 20. Observed and modeled activity of copepods from different louse strains (without previous low salinity exposure history through 30+ generations) as a function of treatment temperature. In the lower panel the observed activity for the strains (LsOslo, LsGulen, and Ls1a) are indicated by strain specific markers. To better show overlapping data points a jittered was applied by up to 0.3 of an activity category and 0.1 salinity ppt. The temperature treatment levels are indicated as labeled x-axis tick values. The upper panel shows the modelled probability of being in an activity category as a function of temperature (calculated from the selected GAM, see section 4.1.3). Activity category is indicated by line type and color and the standard error is shown by the shaded regions around the lines.