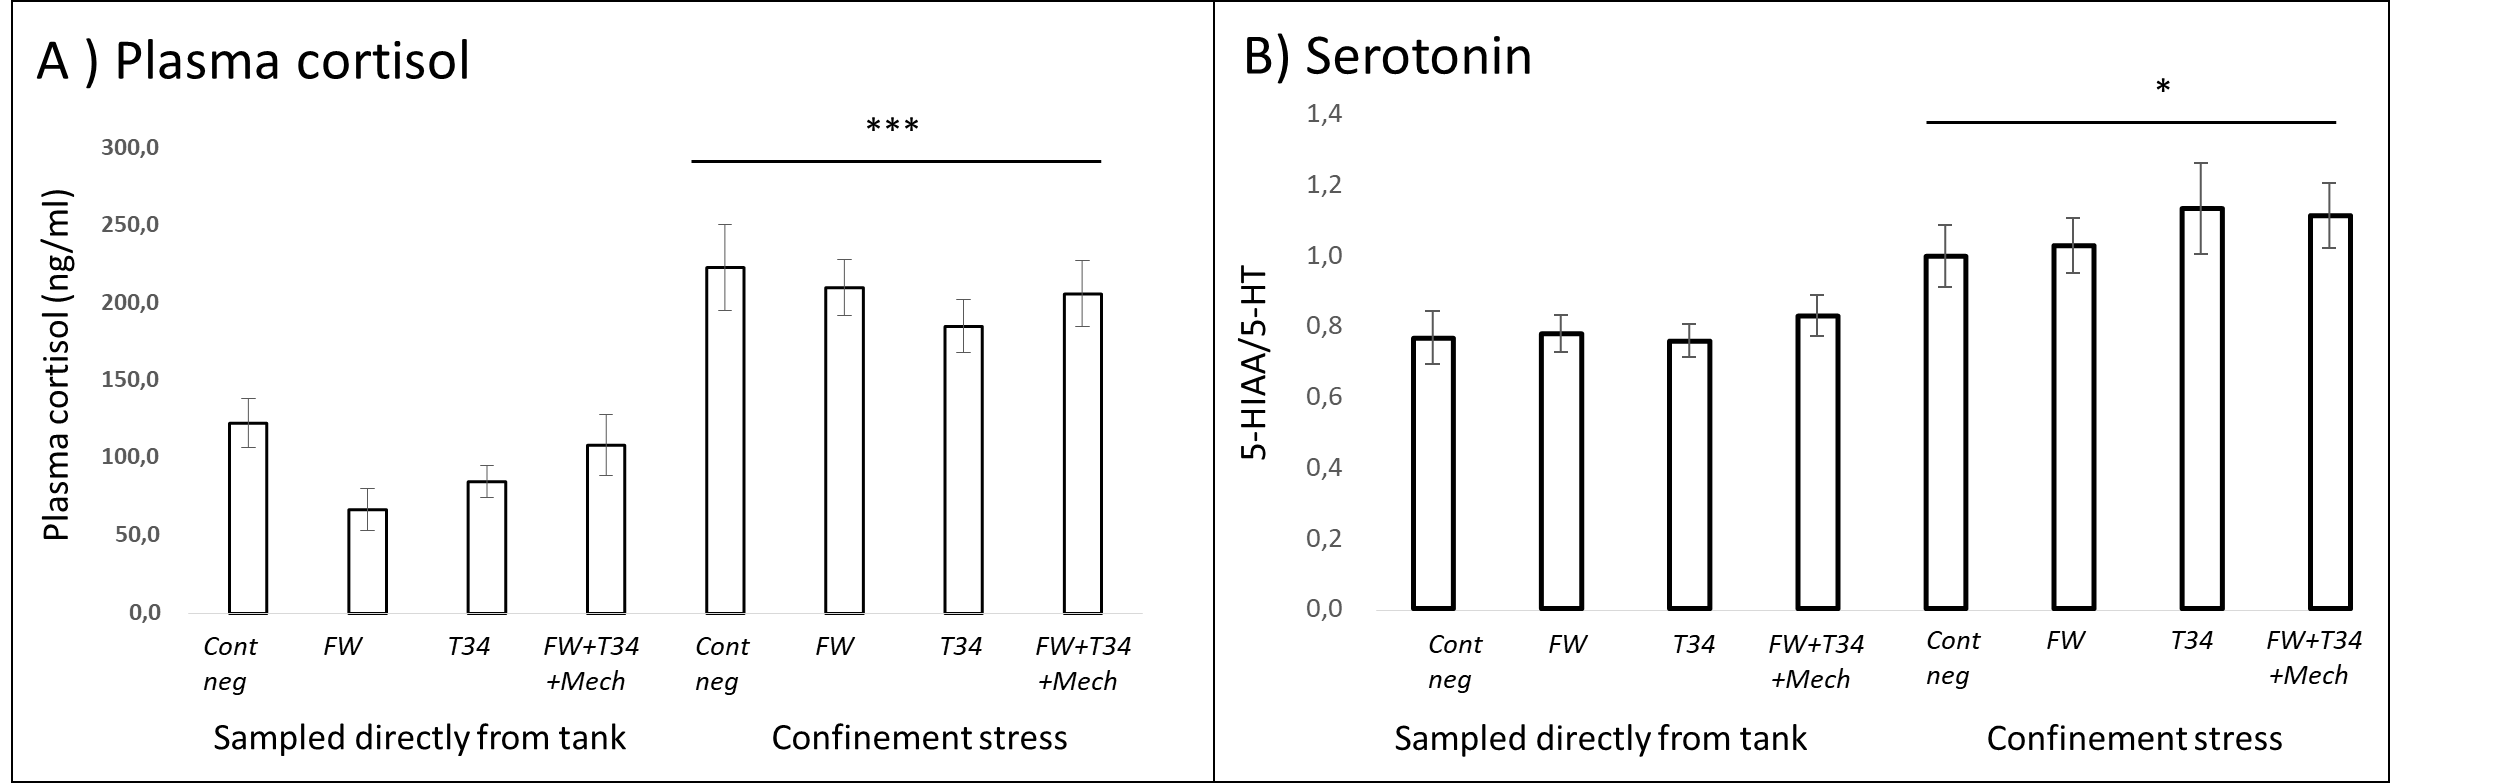
Fig. 10. Stress Responsiveness of Round 1 fish sampled 3 weeks after treatment as measured by A) blood plasma cortisol and neuroendocrine indicators of B) serotonin production in the brain. Significant differences are indicated between fish that were sampled directly and those that were subjected to the confinement stress.