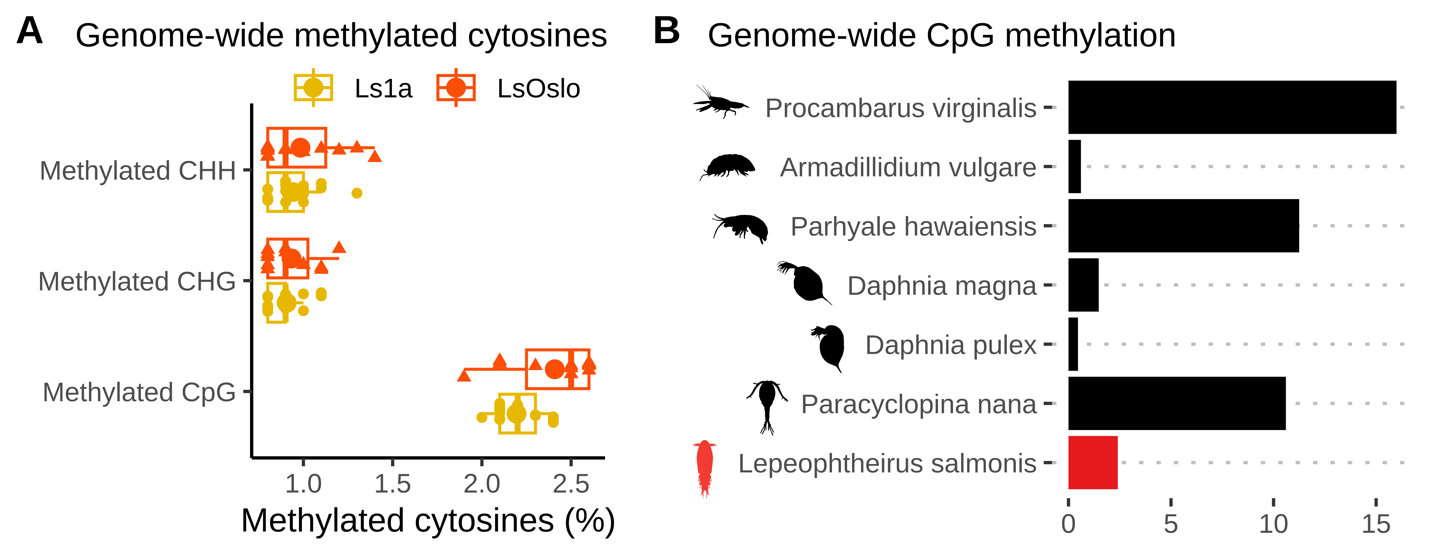
Fig. 24. Genome-wide methylation rates at cytosine sites. (A) A boxplot showing the percentages of methylated cytosines for three different types of cytosine sites, namely CpG, CHG and CHH where H is A, C, or T. (B) A bar plot showing genome-wide CpG methylation rates across seven crustacean species. The methylation rate of Paracyclopina nana was obtained from (Lee et al. 2022), while the rates of the other species were retrieved from (Lewis et al. 2020).