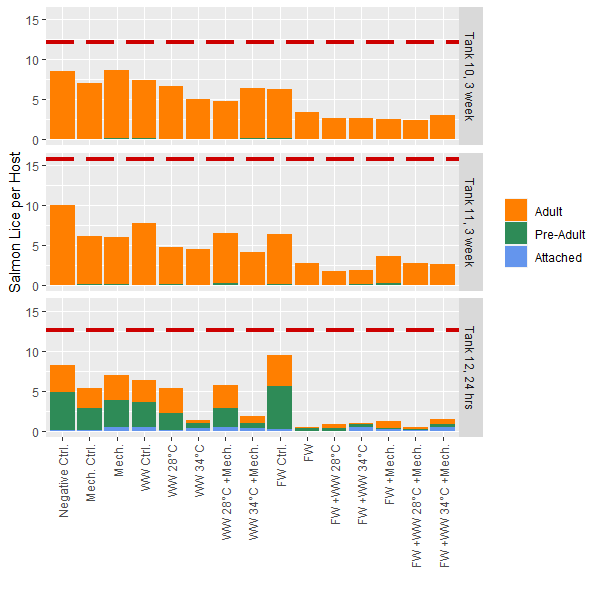
Fig. 2. Post-treatment Salmon Lice Loads, Round 1 Experiment. Mean counts of adult, pre-adult, and attached stages are depicted for each treatment group, separated by experimental tank and sampling time. The mean pre-treatment total lice loads are depicted with the dashed red line for each experimental tank.