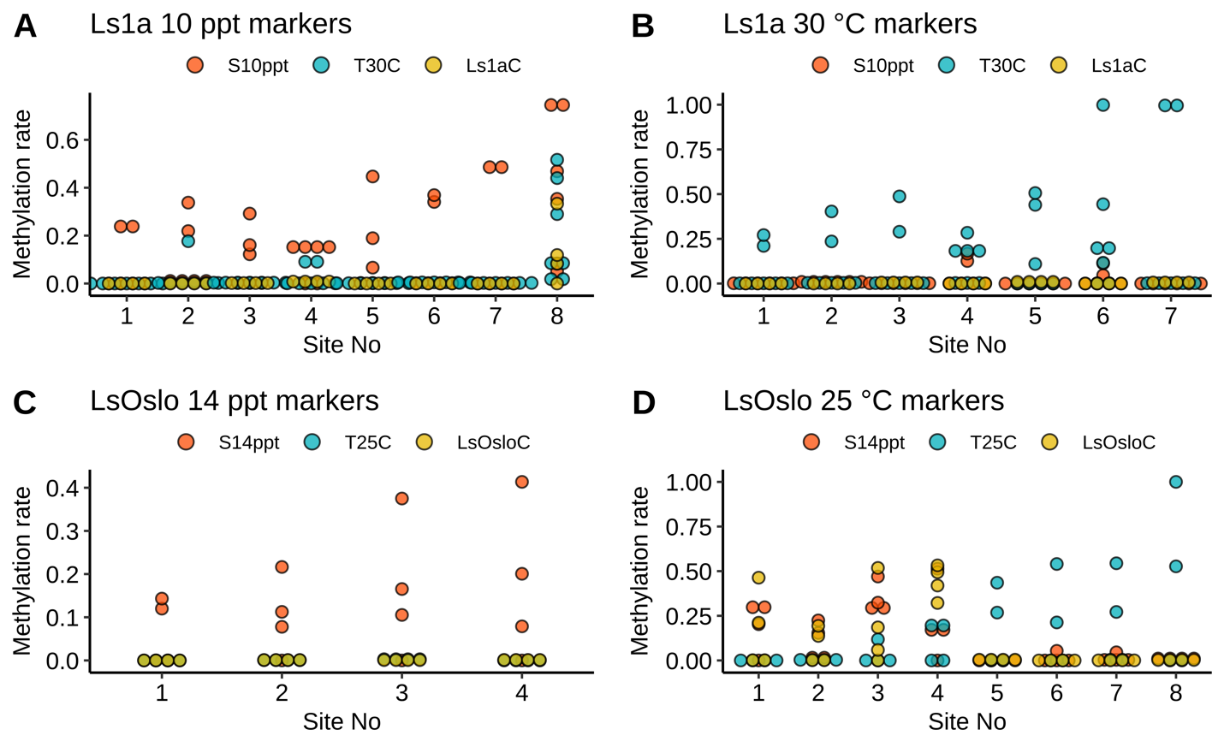
Fig. 26. DNA methylation markers for trans-generational salinity and temperature resilience. Four dot plots showing identified CpG sites as markers with corresponding methylation rates. A total of 27 sites were identified without any overlaps. (A) 8 sites for the salinity treatment in Ls1A, (B) 7 sites for the temperature treatment in Ls1A, (C) 4 sites for the salinity treatment in LsOlso, and (D) 8 sites for the temperature treatment in LsOslo.