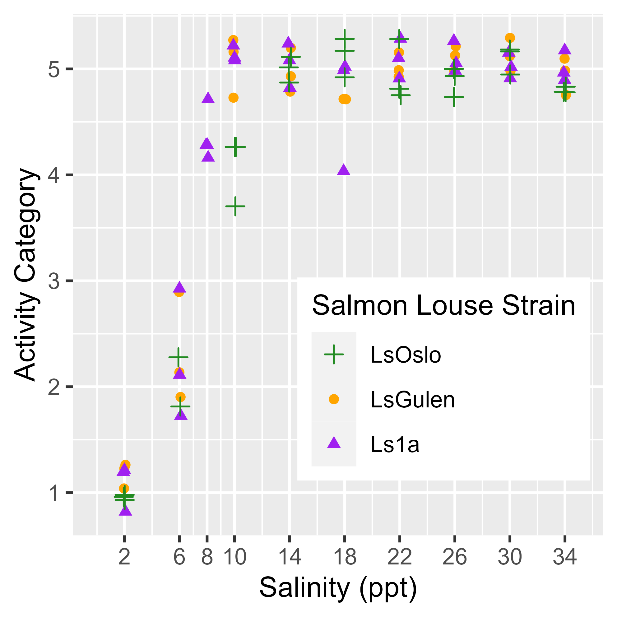
Fig. 18. Activity of copepodids (without previous low salinity exposure history through 30+ generations) as a function of Salinity level (exposures lasting 120 minutes). Figure shows the observed activity category of the copepodids for each of the three strains examined. To better show overlapping data points a jitter was applied by up to 0.3 of an activity category and 0.1 salinity ppt. The salinity levels tried in the exposure experiments are labeled as x-axis ticks.