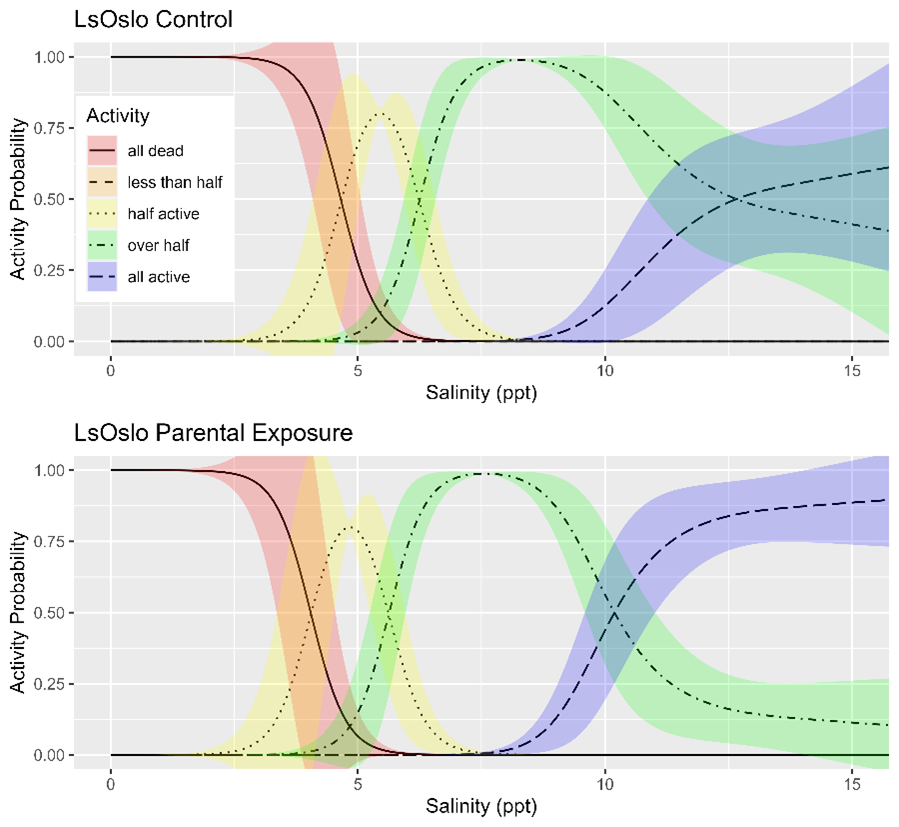
Fig. 23. Modeled activity of copepodids with the probability of being in a category as a function of salinity, which was calculated from the Generalized Additive Model. Activity category is indicated by line type and color with the standard error shown by the shaded regions around the lines. The parental treatment groups are separated by subplot.