Gå til hovedinnhold
Havforskningsinstituttet
HI
English
<- Tilbake
Søk
Søk
Søk
View page in English
Figur
Fra rapporten:
Survey report from the joint Norwegian/Russian Ecosystem Survey in the Barents Sea and the adjacent waters August-December 2022
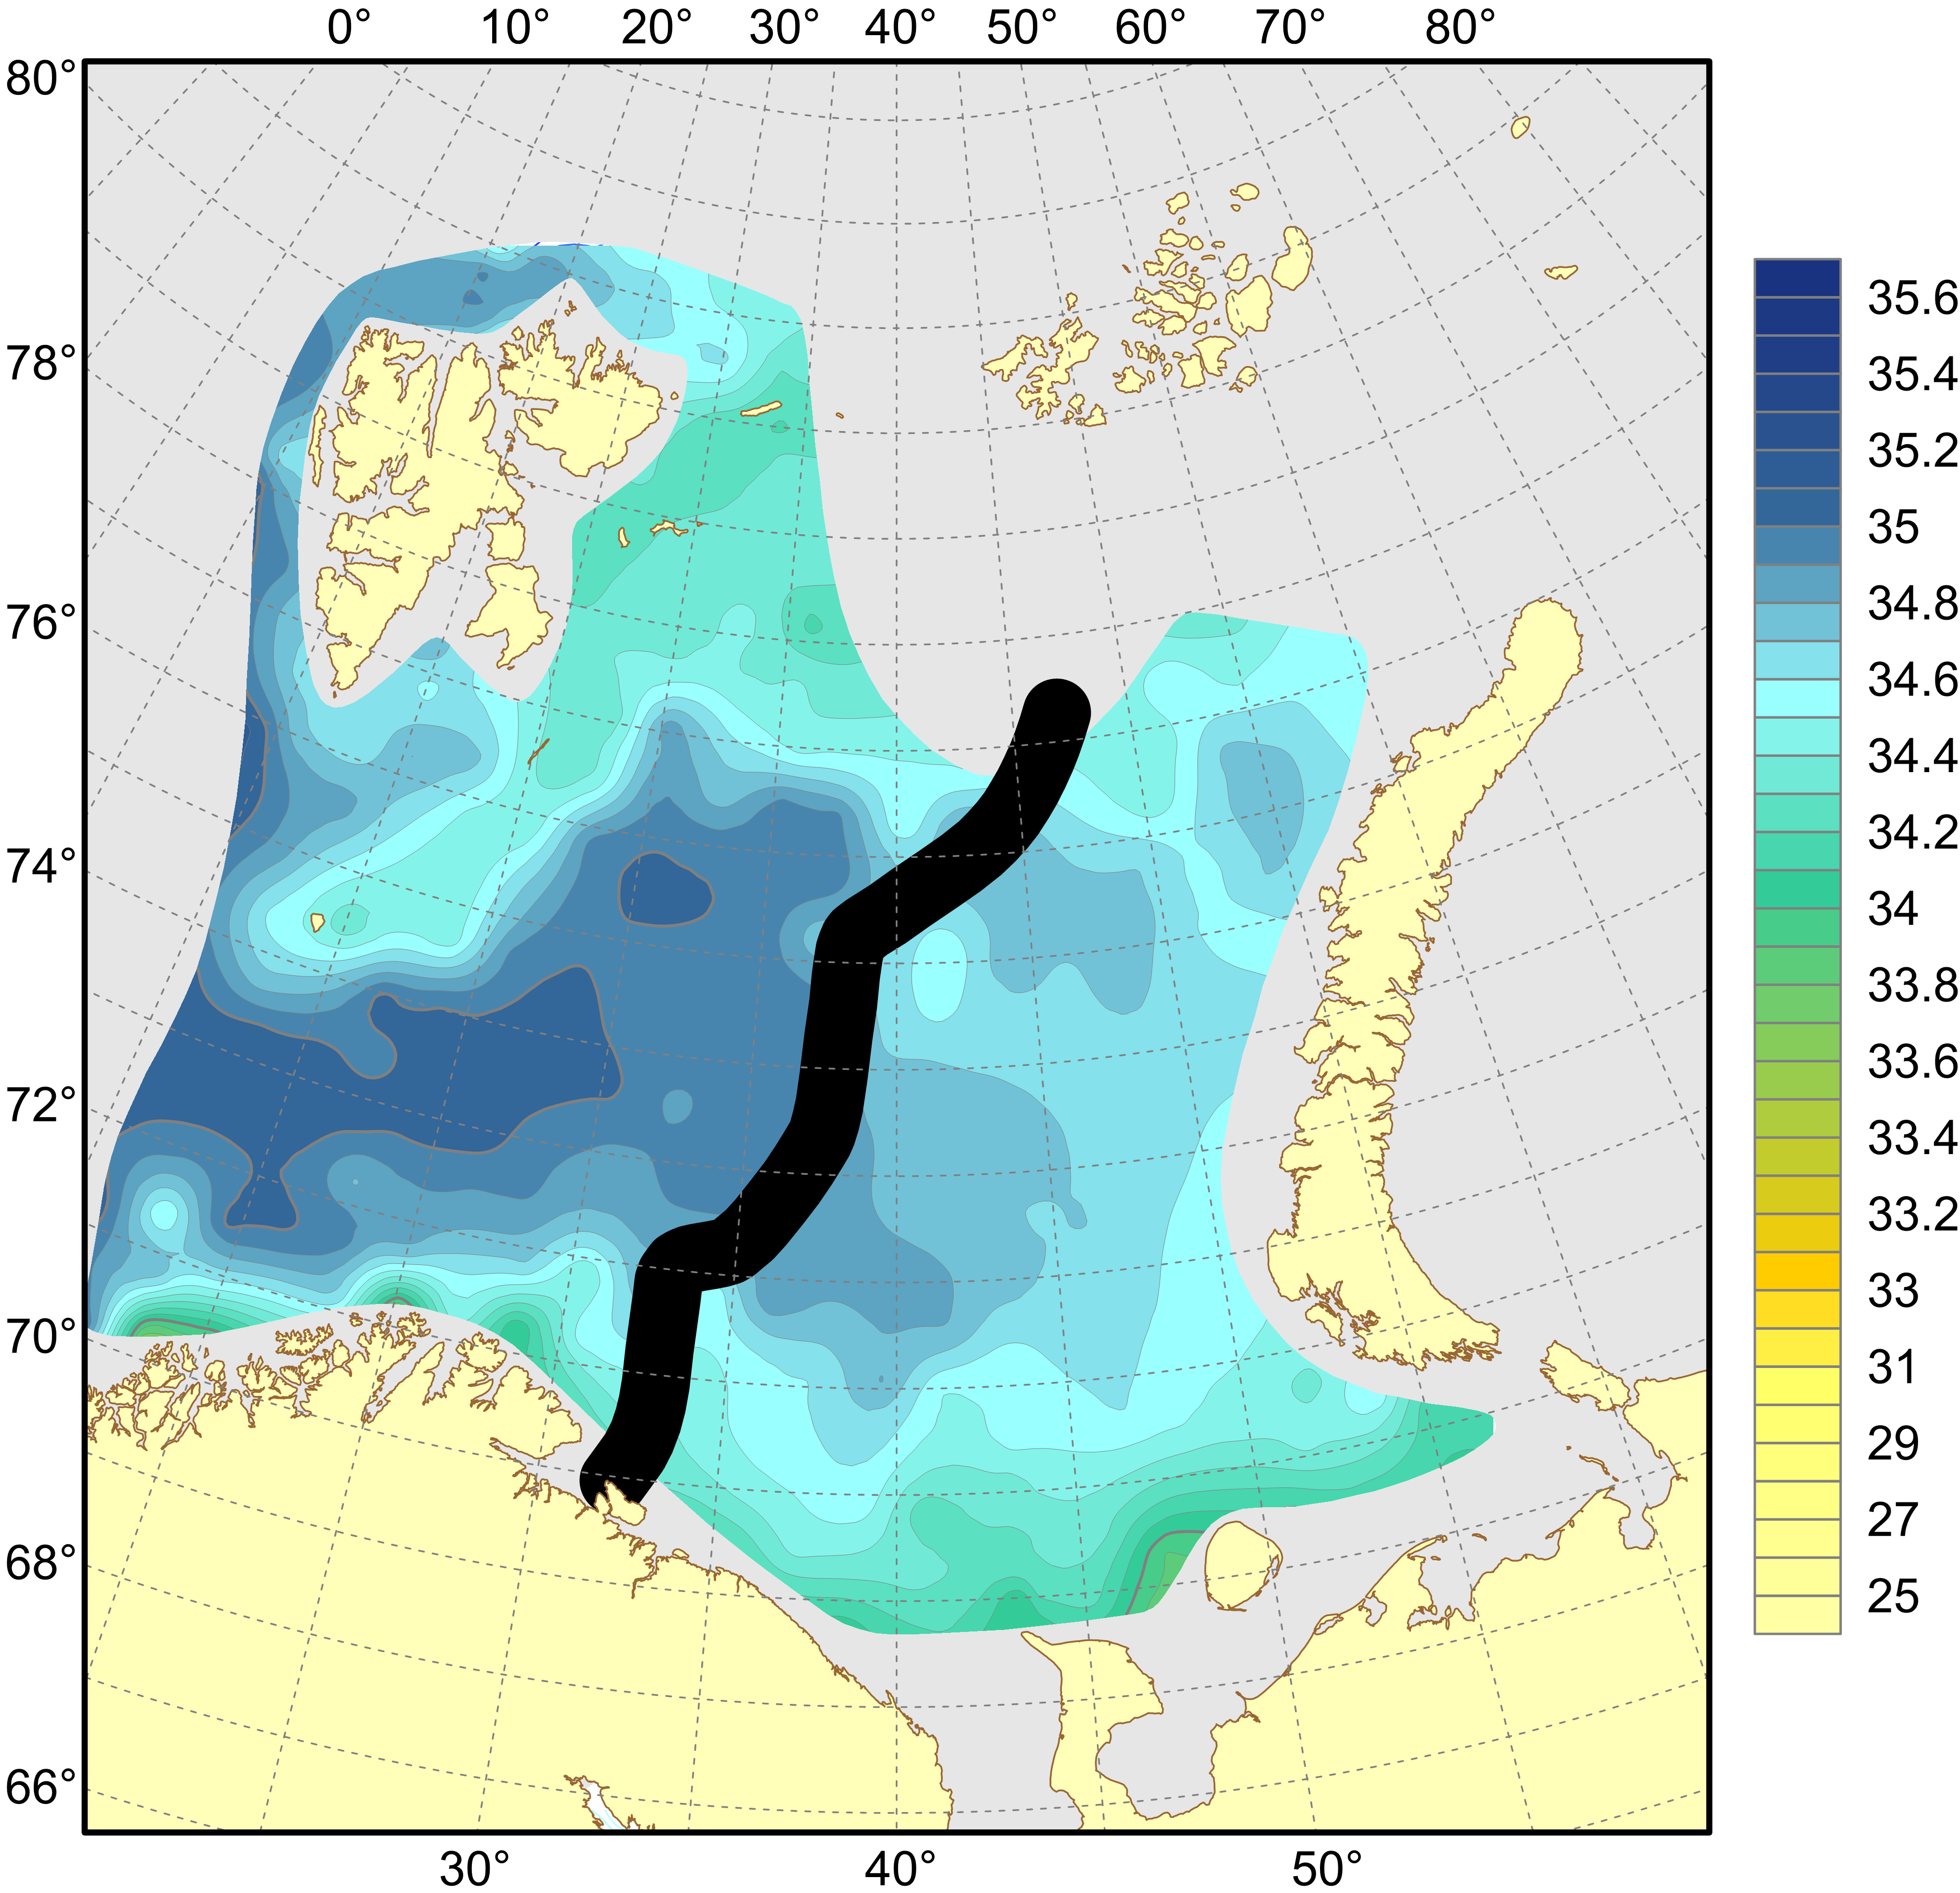
Figure 4.1.1.4. Distribution of salinity at the 50 m depth, August–November 2022. The thick black line is a line of discontinuity in the survey data.