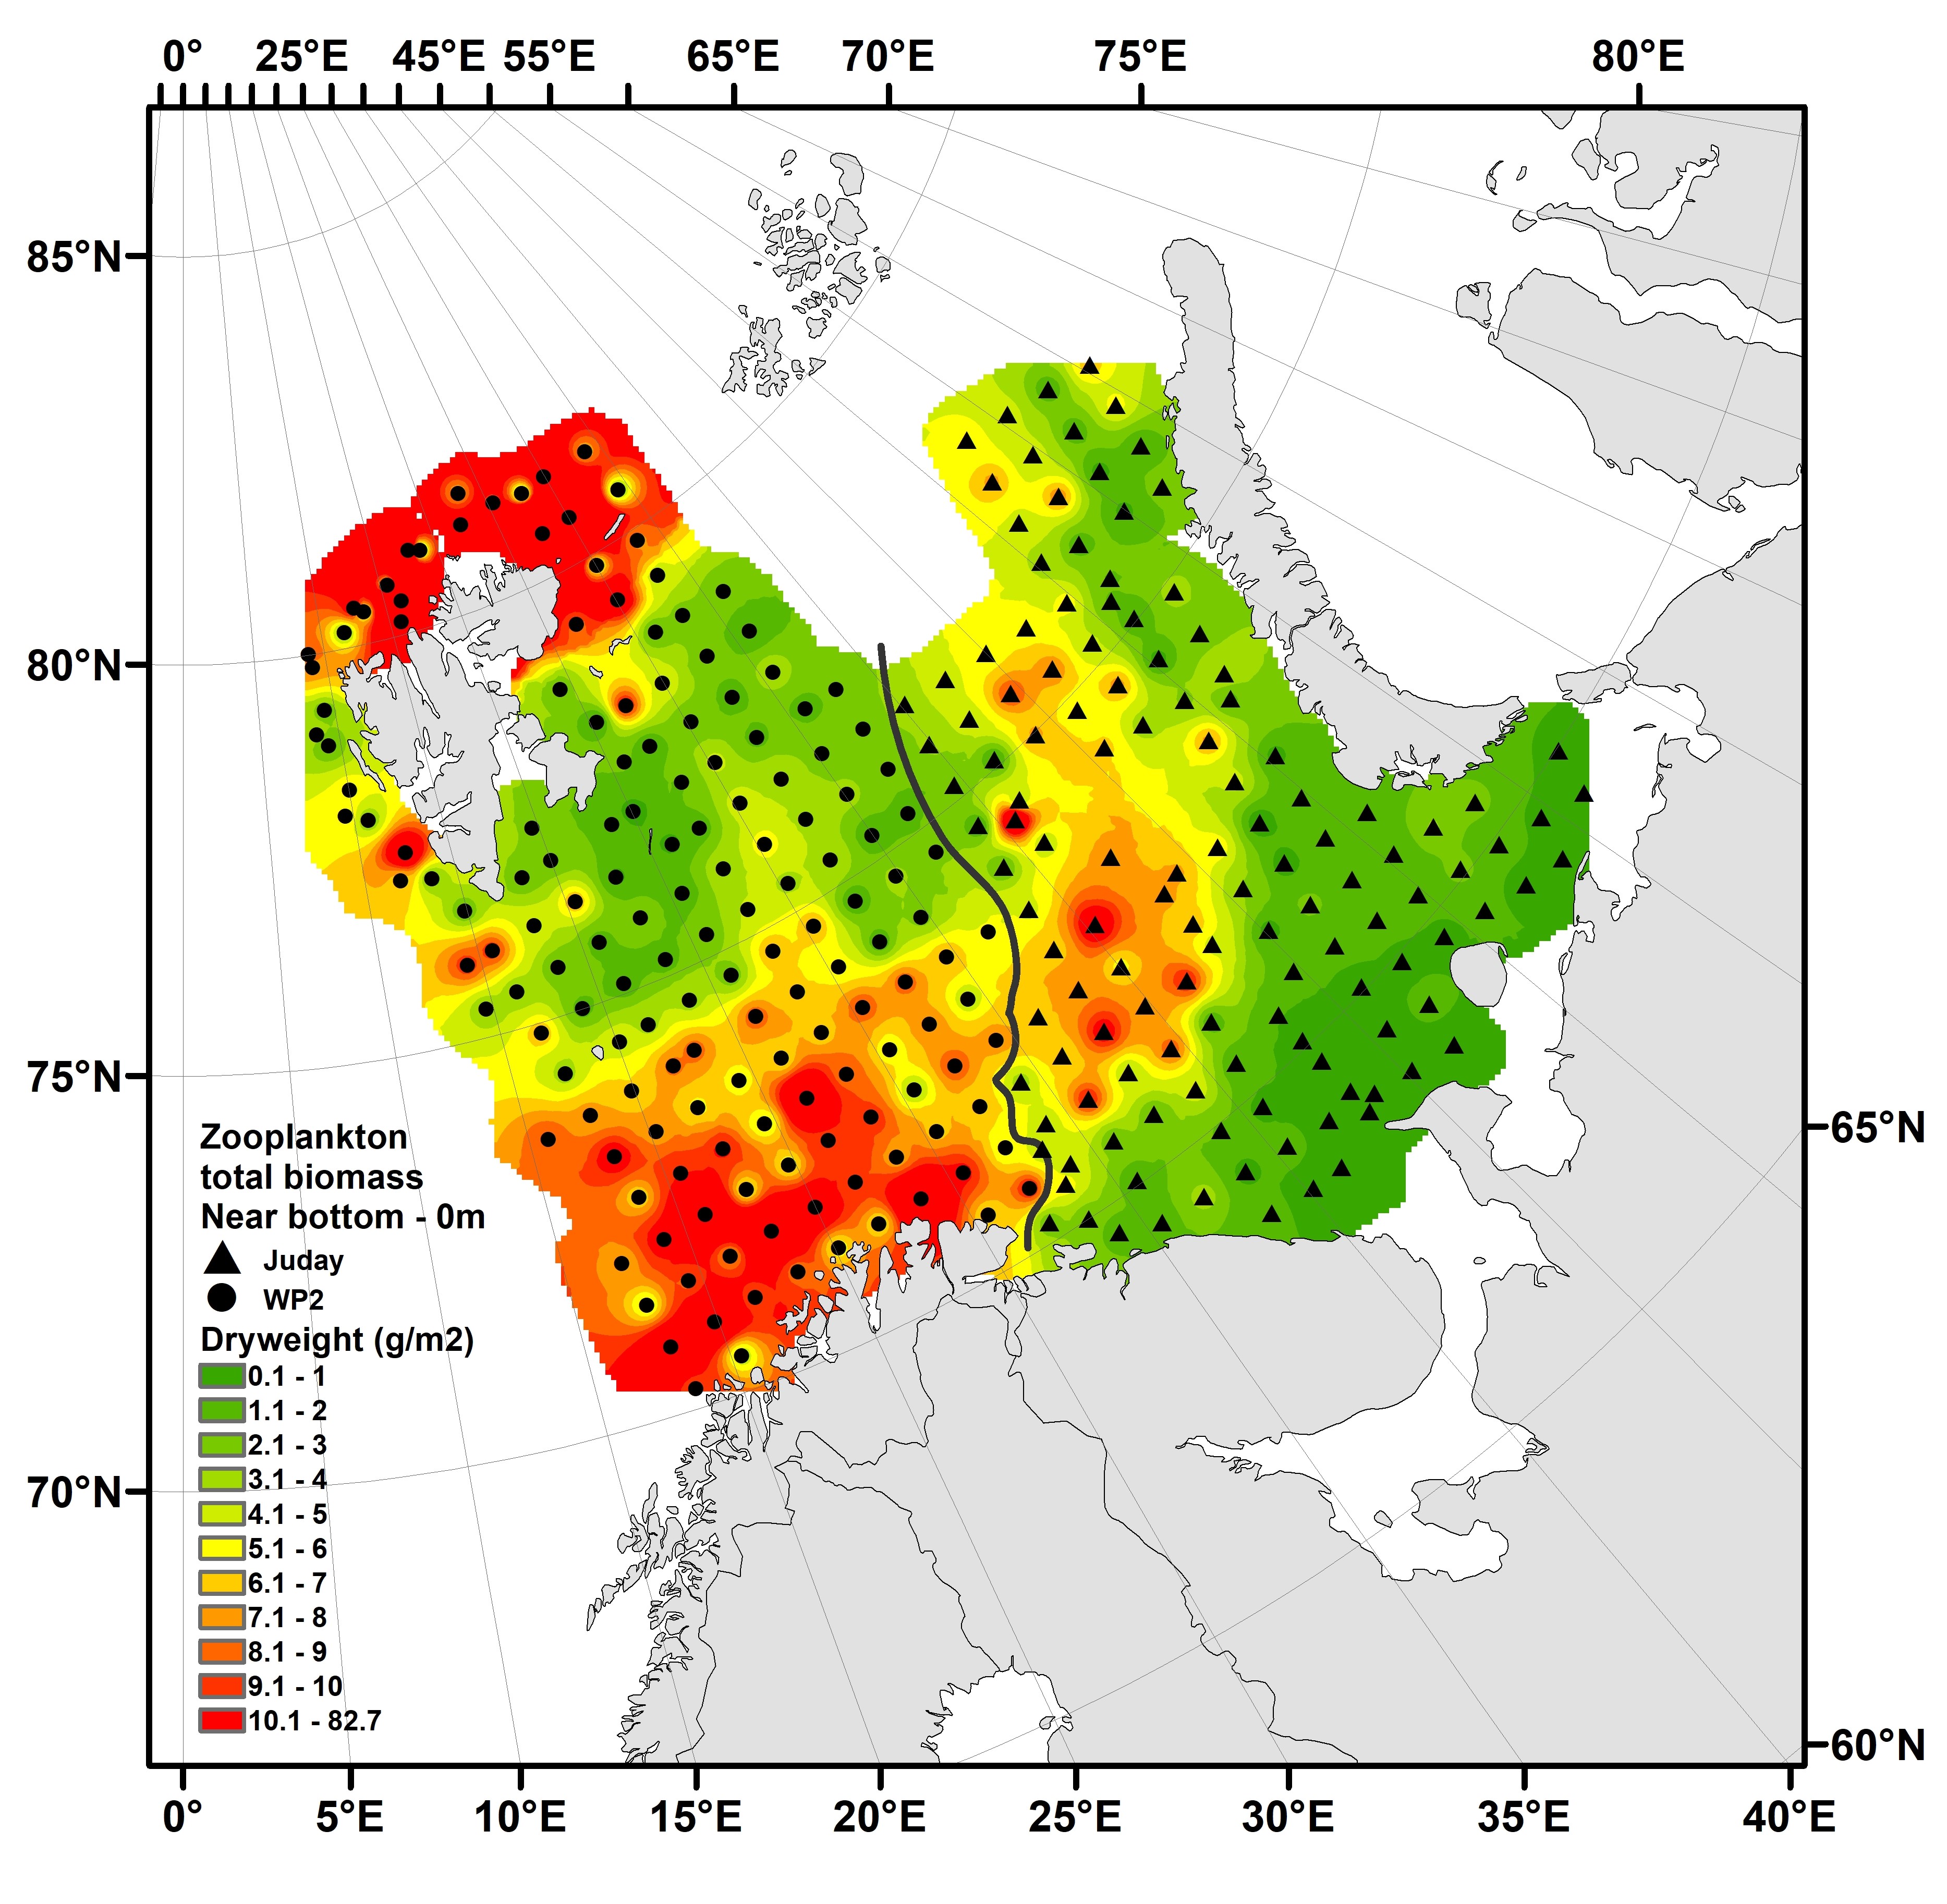
Figure 5.2.1. Distribution of total zooplankton biomass (g dry-weight m-2) from near-bottom to surface in the Barents Sea during BESS 2022 - based on a total of 291 stations. The data visualized were collected by WP2 and Juday nets with mesh-size 180 mm. Interpolation was made in ArcGIS v.10.8, module Spatial Analyst, using inverse distance weighting (IDW). The black line in the figure separates Norwegian and Russian samples. Note that for closely located Norwegian versus Russian stations separated by this line, the difference in sampling-time could vary between ca. 1.5 and 3 months, with the largest differences occurring in the southern area.