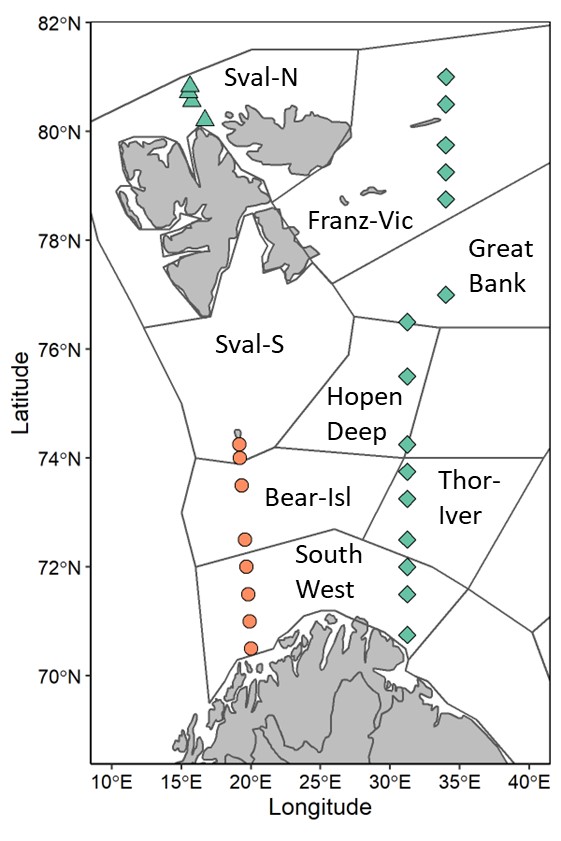
Figure 5.1.1. Map showing stations where samples were collected and analyzed for phytoplankton community composition using microscopy. Outlined areas indicate ICES sub-regions, sampled sub-regions are labeled. Point shape indicates transect, circle: Fulgøya-Bjørnøya, diamond: Vardø-N Utvidet, triangle: Hinlopen. Colors indicate when samples were collected, green: during the 2022 ecosystem cruise, red: spring transect cruise (May-June). Sval-N: Svalbard North, Franz-Vic: Franz Victoria Trough, Sval-S: Svalbard South, Bear-Isl: Bear Island Trench, Thor-Iver: Thor Iversen Bank.