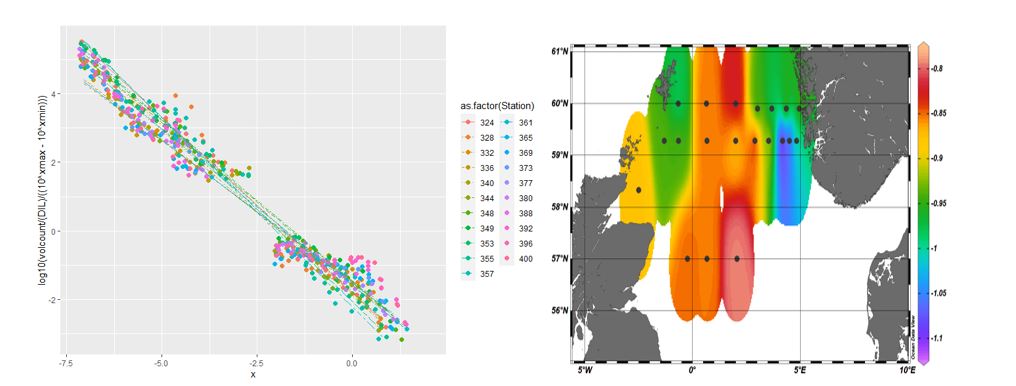
Figure 18. left panel: linear regression between the normalized biovolume for each size class and the cell counts within each size class. The slope informs on the plankton size distribution. The analysis is based on data produced by three FlowCams covering the size range 5-2000µm. Colors correspond to the single stations. Right panel : areal distribution of the slopes. Warmer colors indicate a less steep slope and thus a higher contribution of larger organisms to the plankton community.