Gå til hovedinnhold
Havforskningsinstituttet
HI
English
<- Tilbake
Søk
Søk
Søk
View page in English
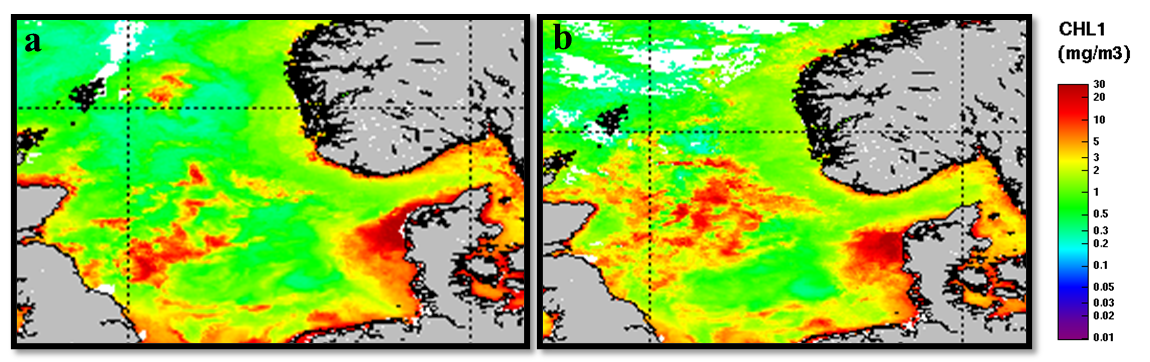
Figur
Fra rapporten:
North Sea Ecosystem Cruise ReportJH2022206
Figure 7. Evolution of the 8 days mean surface chlorophyll-a concentrations from MODIS satellite imagery over the period 14.04.2022 to 26.04.2022. a) 14.04-22.04; b) 23.04-30.04.