Gå til hovedinnhold
Havforskningsinstituttet
HI
English
<- Tilbake
Søk
Søk
Søk
View page in English
Figur
Fra rapporten:
North Sea Ecosystem Cruise ReportJH2022206
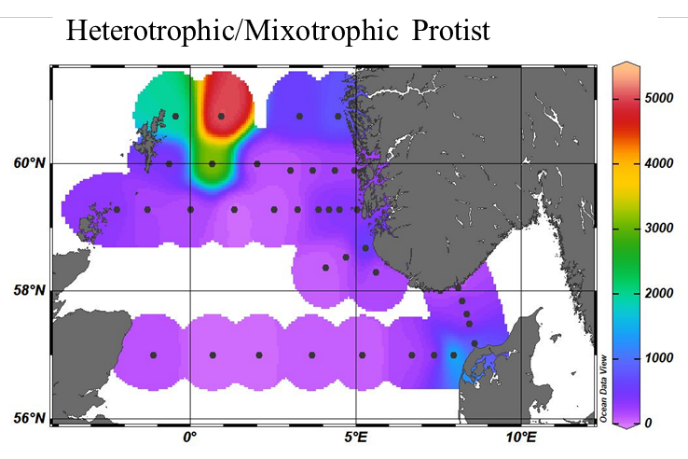
Figure 16. Heterotrophic and mixotrophic protist abundance distribution based on imaging analysis using a Flowcam VS.