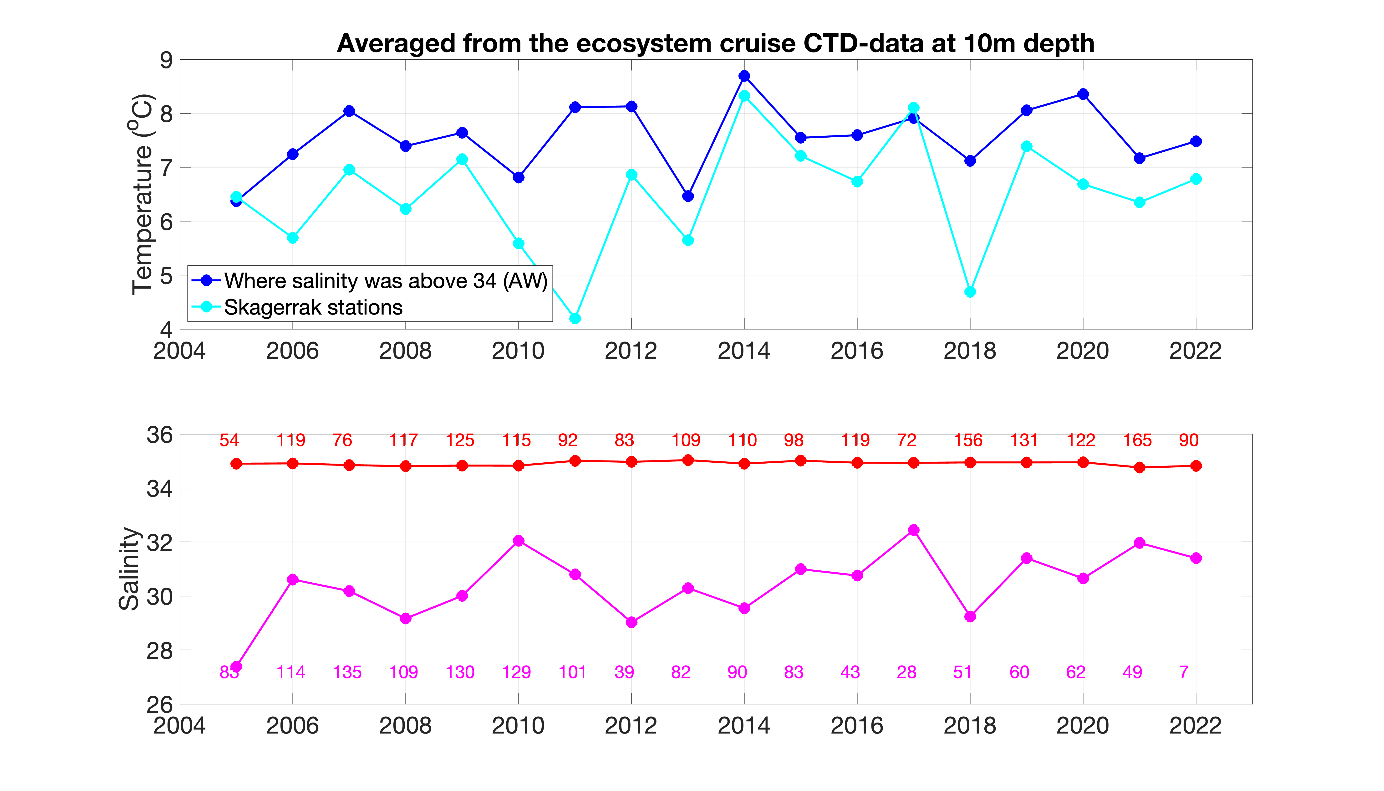
Figure 5. Time series of temperature (upper panel) and salinity (lower) at 10m depth as a spatial average over all ecosystem cruise stations for each year from 2005 to 2022. The stations have been separated in two categories: Atlantic water masses with salinity above 34 (blue and red) and Skagerrak stations (cyan and purple). Since the station coverage each year varies, the number of valid data points is written as numbers in the lower panel.