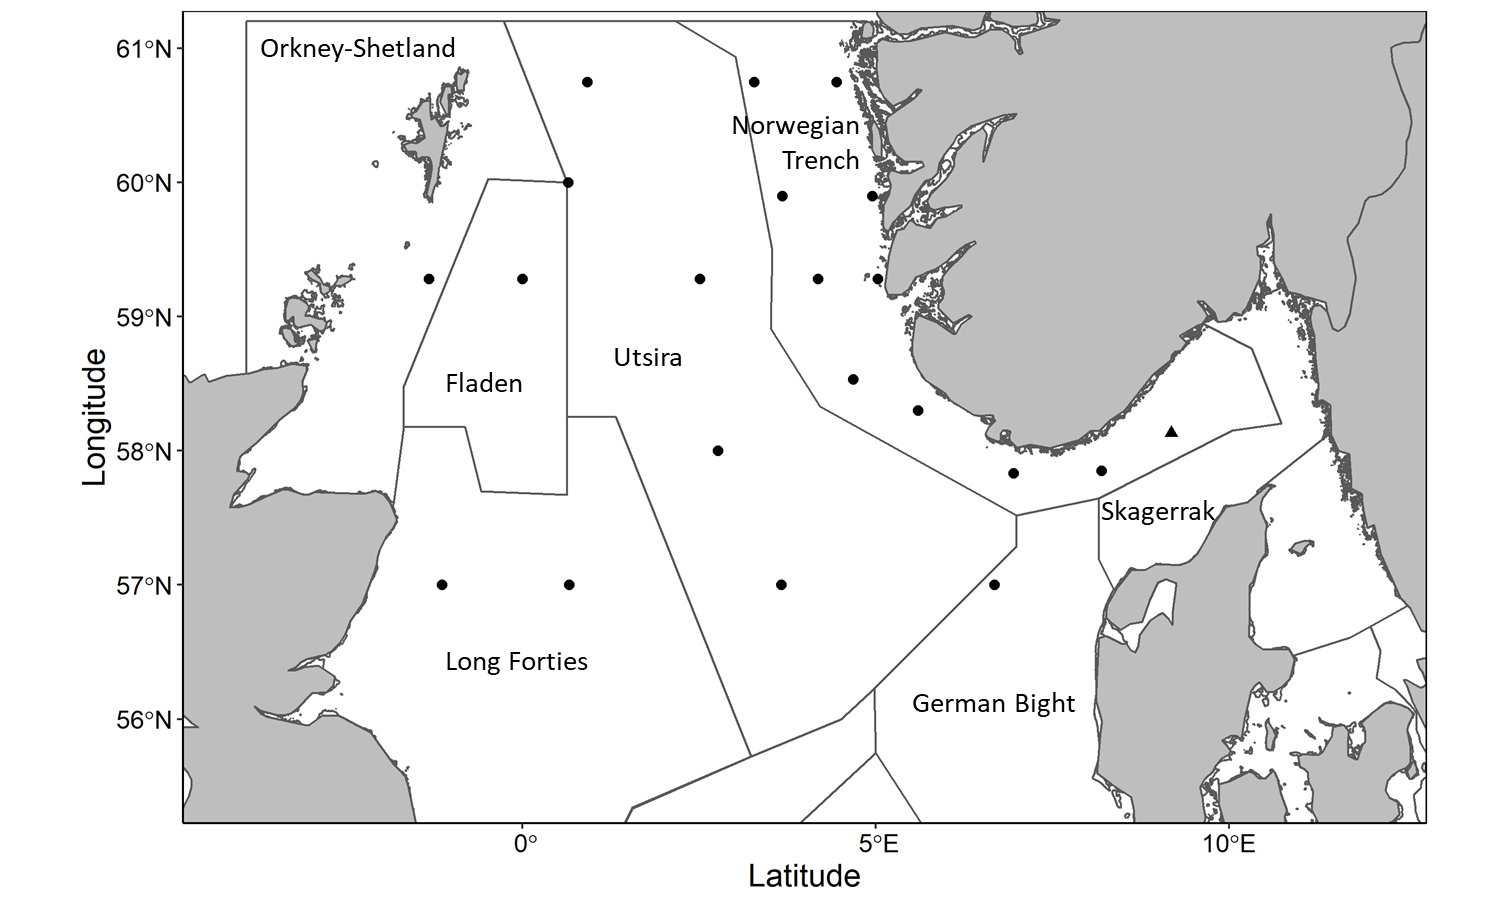
Figure 10. Map showing stations where samples were collected and analyzed for phytoplankton community composition using microscopy. Outlined areas indicate WGINOSE sub-regions. Shape indicates the cruise a sample was collected on, circle: 2022206 ecosystem cruise, triangle: April Torungen-Hirtshals cruise.