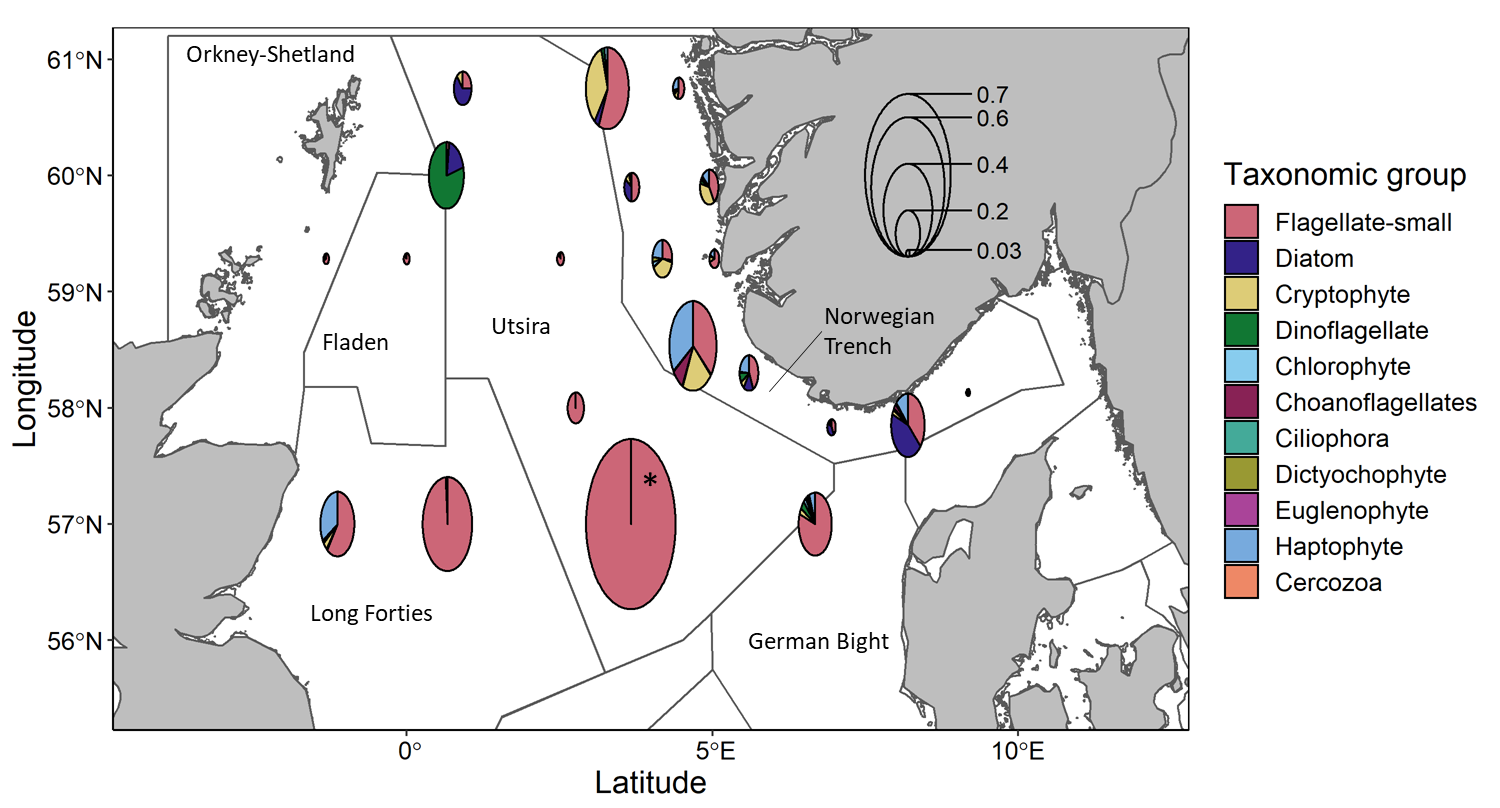
Figure 11. Map showing plankton community composition and abundance at all sampled stations. Pie chart radii scale to average cell concentrations in 2×10 6 cells ml -1 except for * station scaled to 4×10 6 cells ml -1 to allow all stations to be visualized together. Divisions within pie charts show the contributions from broad taxonomic groups.