Gå til hovedinnhold
Havforskningsinstituttet
HI
English
<- Tilbake
Søk
Søk
Søk
View page in English
Figur
Fra rapporten:
North Sea Ecosystem Cruise ReportJH2022206
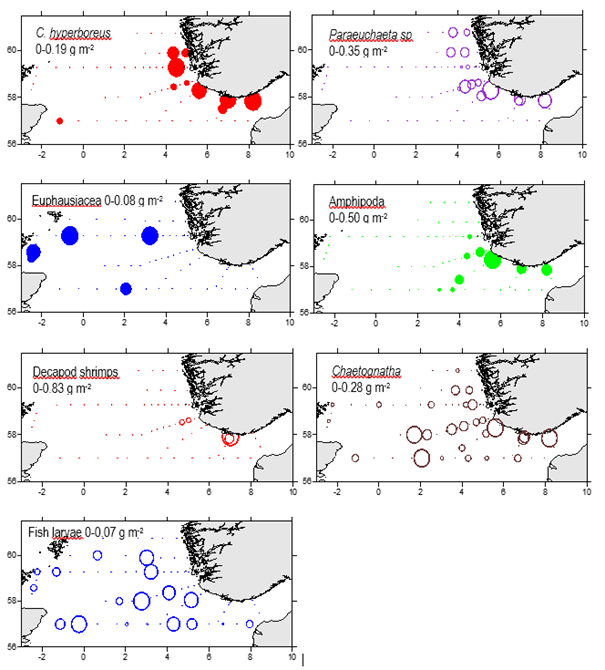
Figure 22. Biomass of selected groups of zooplankton in the >2000µm fraction (in WP2 net tows, 180 µm, bottom-surface). All data square root transformed.