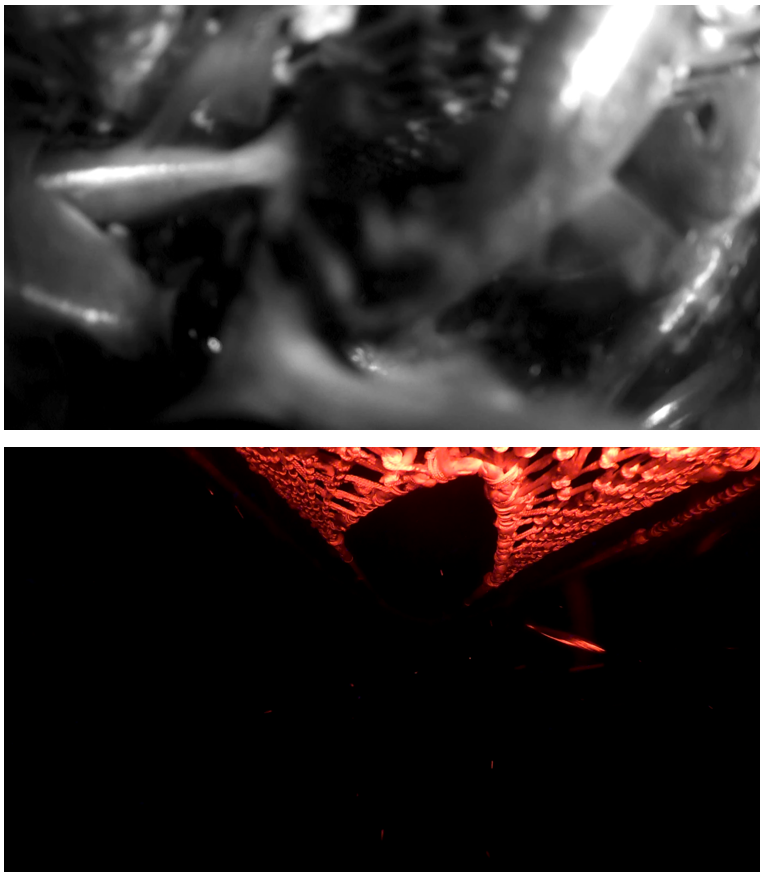
Figure 3.4 – Images from video taken during haul 05 at 21:19, approximately 1 hour before the start of haul-back at 22:24. Top: from position 5iB looking aft toward the fish-lock and cod-end, showing high densities of fish in the top of the FRS. Bottom from position 2oF, looking forward below the escape opening, with relatively few fish escaping, despite the high densities above. Note – the escape rate at this time was approximately 38 fish/minute [21:19-21:20].