Figur
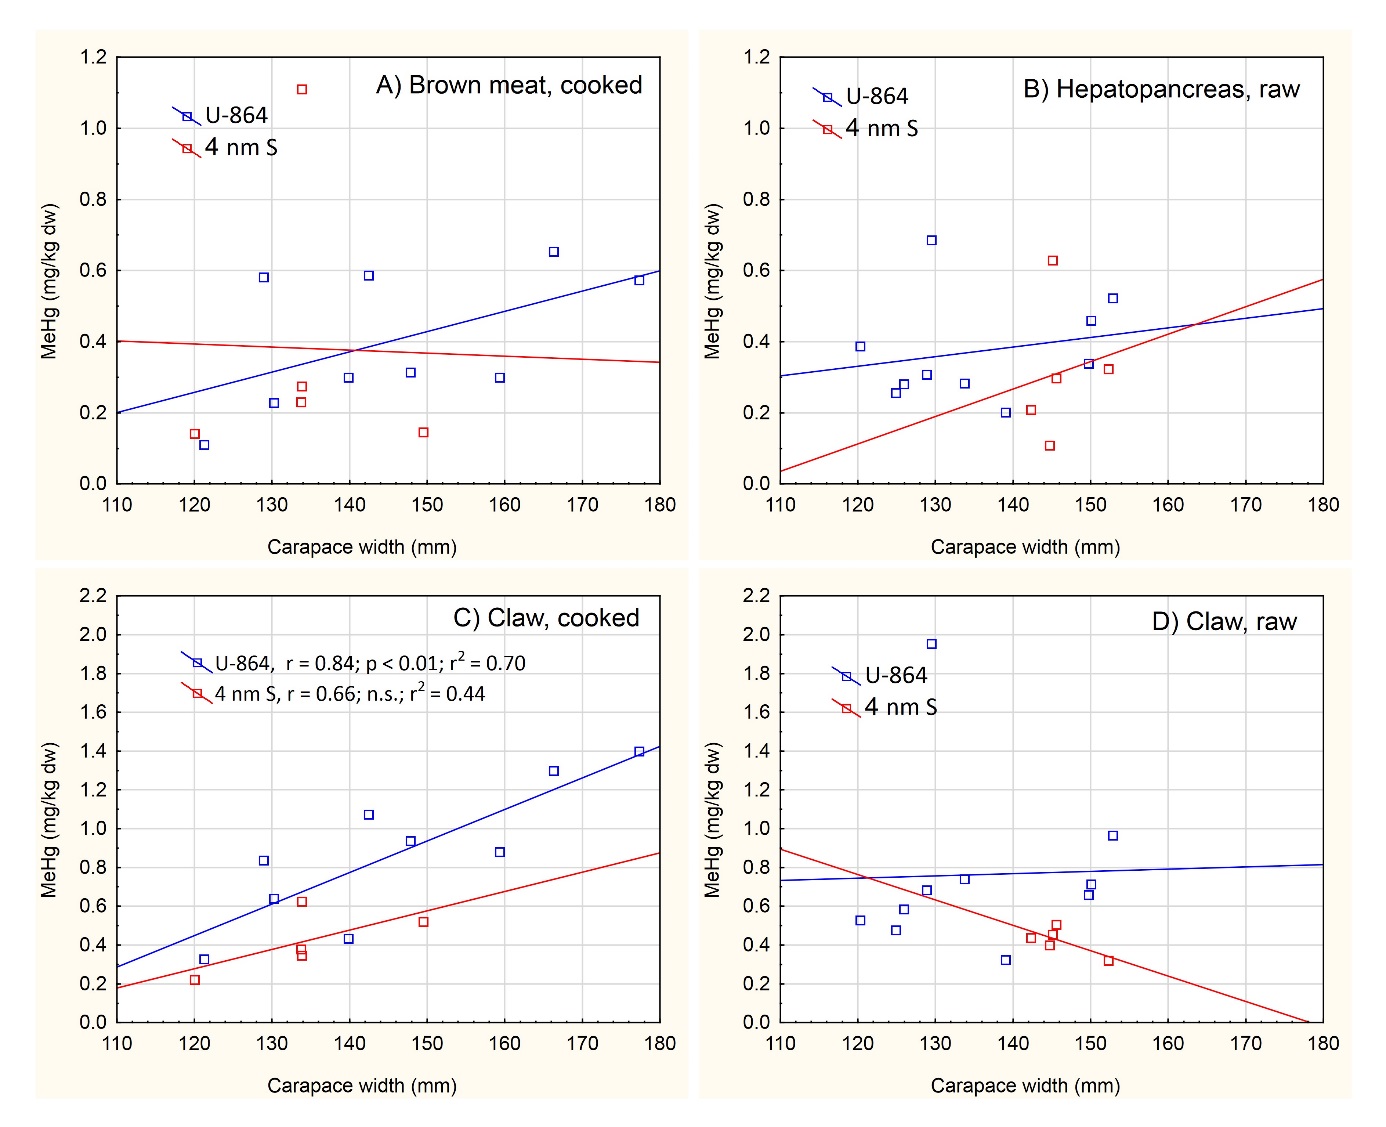
A2. Scatterplots between crab size (carapace width, mm) and dry
weight MeHg concentration (mg/kg dw), given for A) brown meat of
cooked crab, B) hepatopancreas of raw crab, C) claw meat of cooked
crab and D) Claw meat of raw crab. Different sampling sites are
indicated with different colours: Blue: Site of U-864 wreck; Red: 4
nautical mils south (nm S) of the wreck; Correlation results are
shown where there was any significant correlation.