Figure
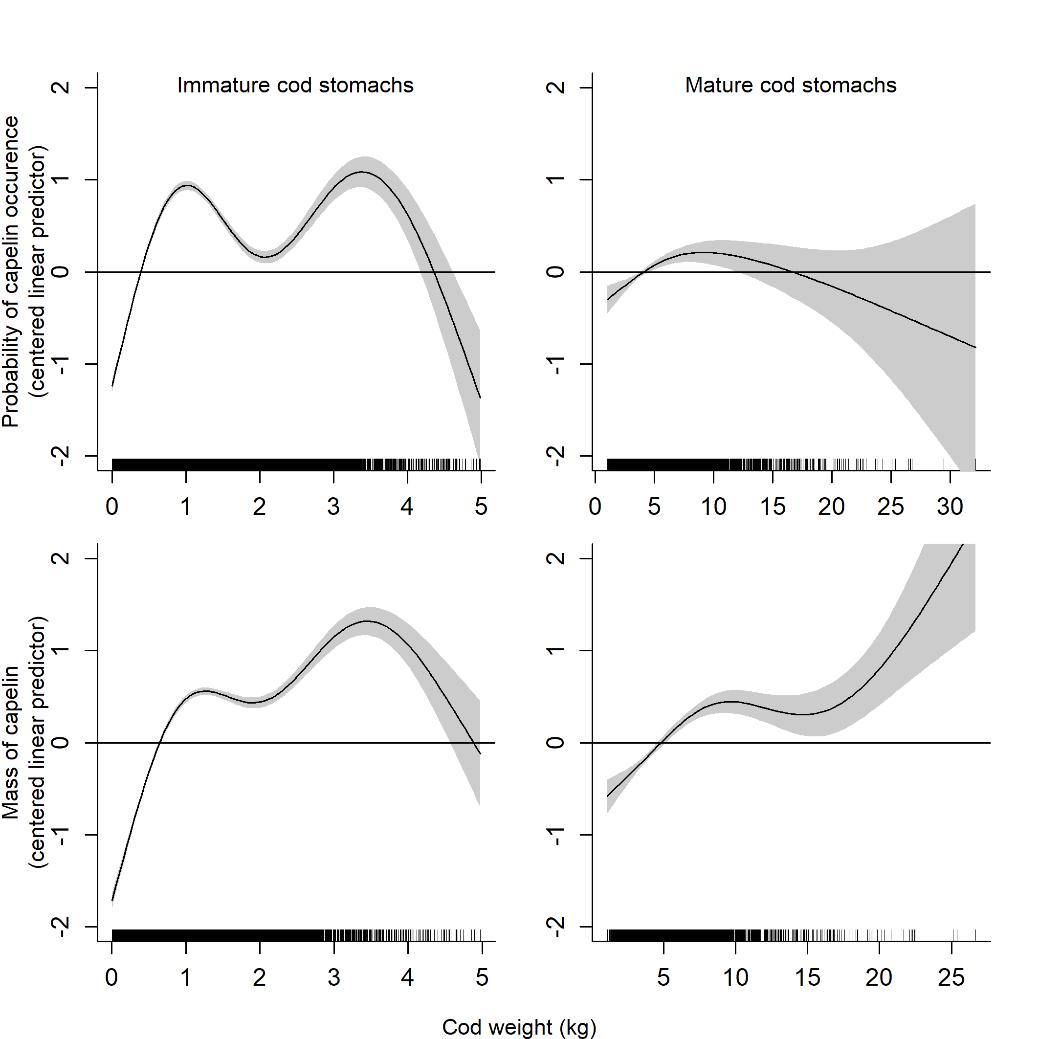
3.6: GAM smooth functions of cod weight showing the contribution of
this variable to variations in capelin probability of occurrence
(upper panels) and mass (lower panels) in immature cod stomachs (left
panels) and mature cod stomachs (right panels). The y-axis shows the
(centred) linear predictor of the models, i.e., the logit probability
of capelin occurrence in the upper panels and the log mass of capelin
in the lower panels, as a function of cod weight when accounting for
the other covariate effects. The horizontal line at y = 0 represents
a neutral contribution of the covariate to the response, and the grey
bands represent ± 2 standard errors around the smooth estimate. The
dashes along the x-axis show the distribution of covariate values in
the raw data.