Figure
2.
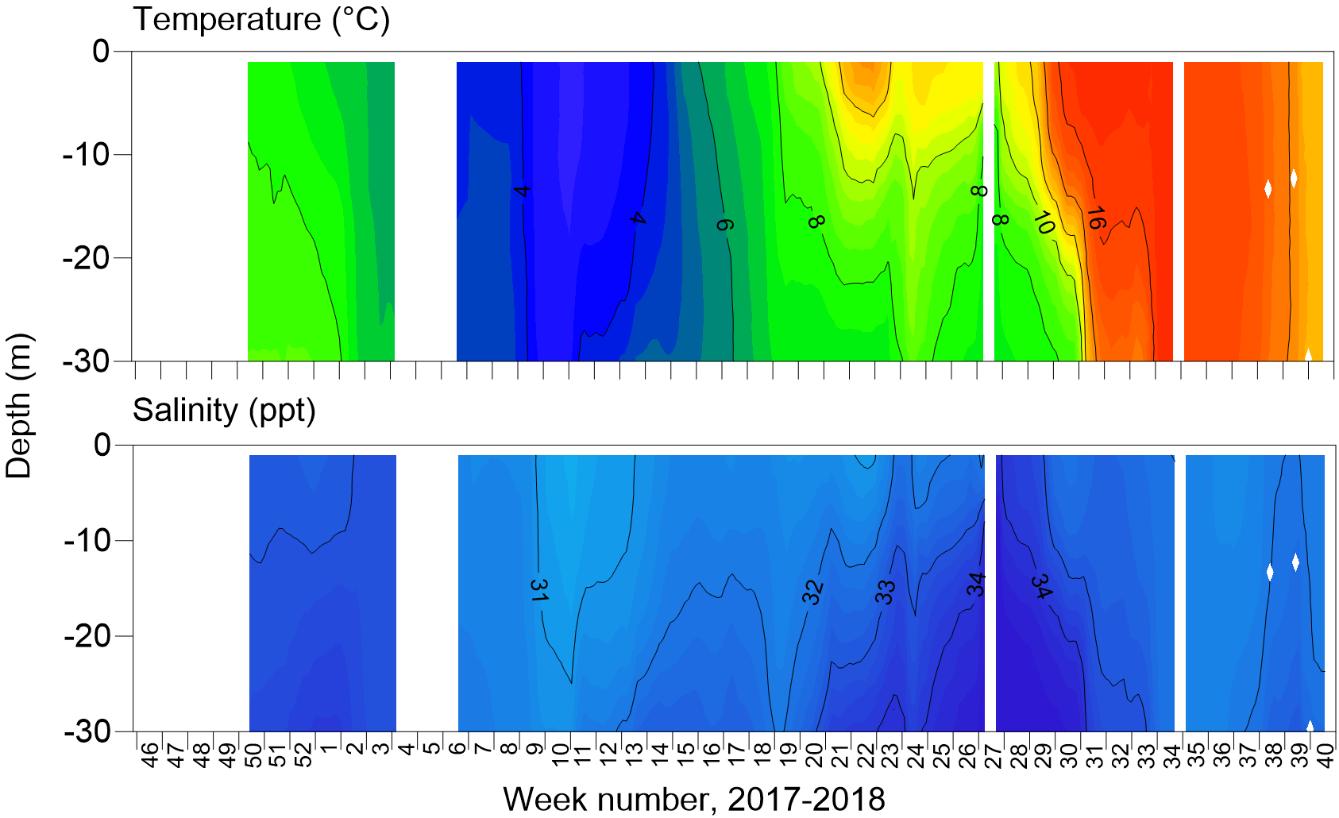
Temperature and salinity conditions in 0−30 m at the Haverøy barge
from December 2017 until October 2018. Temperature and salinity
levels are indicated by black contour lines every 2 °C and 1 ppt,
respectively. Gaps indicate periods of no data.