Figure
8.
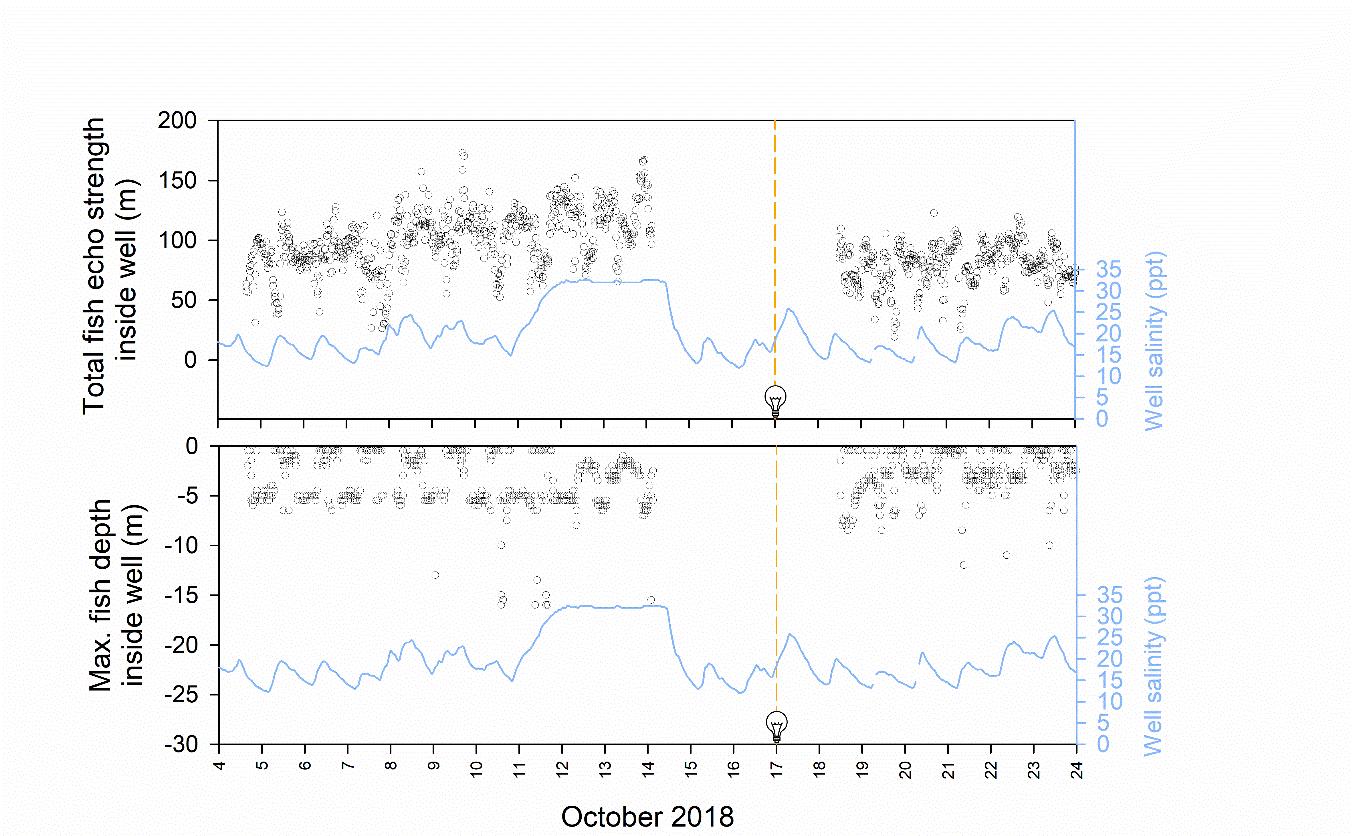
From the freshwater lens pool of a single well cage, measurements of
total fish echo signal strength (top plot) and the depth band with
the maximum fish echo signal strength (bottom plot, black open
circles) plotted over time from 4–24 October 2018. Mean hourly
salinity at 1 m within the freshwater lens well pool is also shown
(blue lines). Lights within the well pool were installed from 17
October. Tick marks on the x axis are position at 0000 h.