Figure
5.
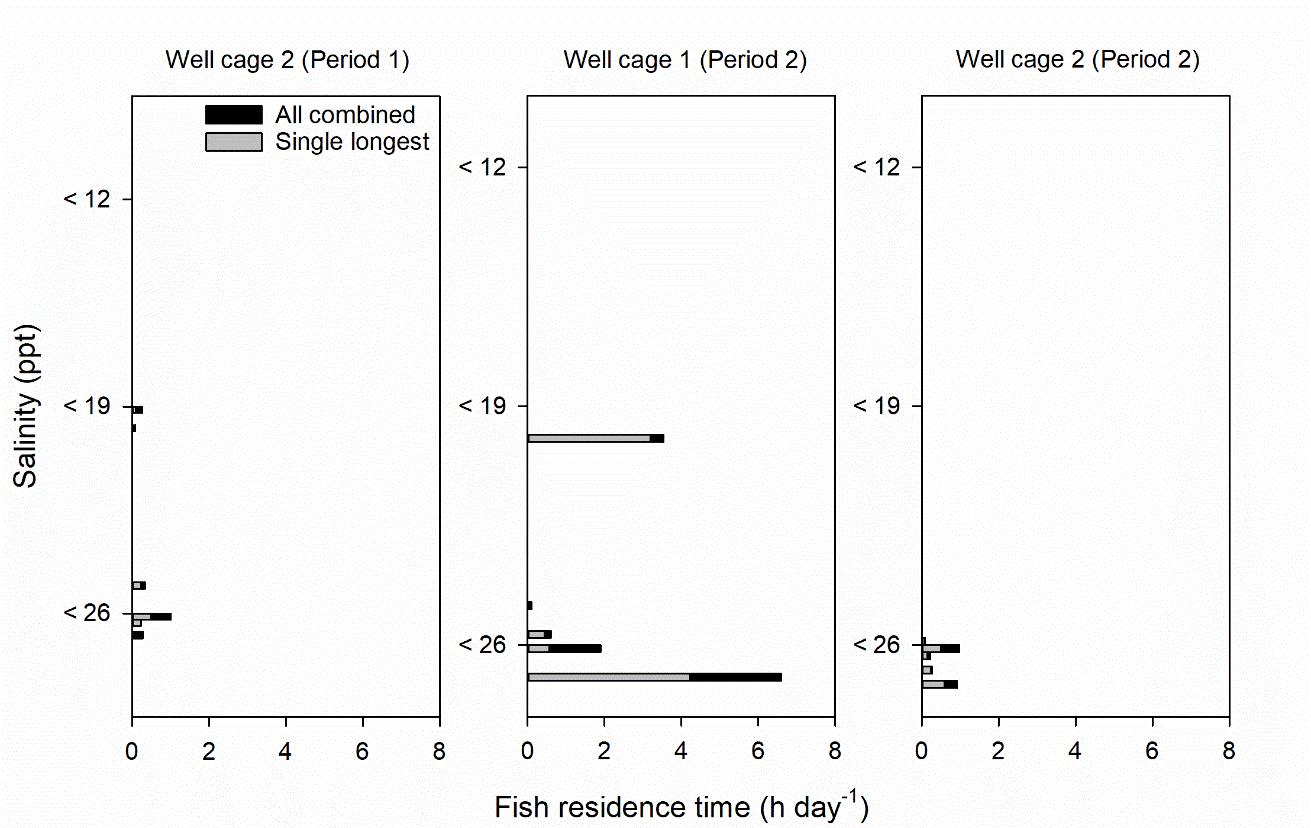
Fish residence times by each tagged individual in salinities of [
12, [ 19 and [ 26 ppt (each bar represents one individual) in
well cages and periods where [ 26 ppt recordings were detected
(only periods 1 and 2). Mean hourly salinity recordings were used.
Residence time was recalculated to hours per day to standardise for
the different monitoring periods. Black bars in the background
represent fish residence times based on all recordings combined in a
salinity category, while grey bars in the foreground are fish
residence times based on the single longest duration of consecutive
recordings in a salinity category. This gave an indication of whether
fish residence at the different salinity categories was characterised
by short frequent episodes or long rare episodes.