Prosjektet undersøkte om kombinasjon av brakkvannsbasseng, luseskjørt, målrettet belysning og dyp fôring i kommersielle merder var effektivt i å forebygge lusepåslag. Grunnleggende kunnskap om laksens valg av opphold i brakkvann ble studert med individmerket laks og dødelighet hos lakseluskopepoditter i kar med ulike brakkvann og oppholdstid. Ingen signifikant effekt på lusenivå eller fiskevelferd ble funnet av standardskjørt og brakkvannsbasseng i perioden da oppsettet fungerte optimalt. Laksen hadde variabel bruk av bassenget, og nattbelysning så ut til å øke fiskens oppholdstid i brakkvannet. En endelig konklusjon om effektiviteten mot lus av denne teknologien kan imidlertid ikke trekkes. En kan imidlertid konkludere at det er et klart behov for lavere saltholdighet i kombinasjon med høyere oppholdstid for at brakkvannet skal kunne ha en betydelig reduserende effekt på lusens påslag, dødelighet og utviklingstid. Karforsøkene viste at lusens utviklingstid ble forsinket ved saltholdigheter < 12 ppt, og for å ta livet av påslåtte kopepoditter er det nødvendig med saltholdighet < 4 ppt over 3 timer eller lengre.
The Well – Mixing skirt and freshwater lens concepts with smart-lighting and -feeding to enhance lice prevention and safeguard fish welfare
Report series:
Rapport fra havforskningen 2019-3
ISSN: 1893-4536
Published: 24.01.2019
Updated: 08.05.2019
Project No.: 14597-10
On request by: Mowi, FHF
Reference: FHF 901469
Research group(s):
Animal welfare
Program:
Environmental Impacts of Aquaculture
Approved by:
Research Director(s):
Geir Lasse Taranger
Program leader(s):
Terje Svåsand
Norsk sammendrag
Summary
A commercial scale sea-cage design, combining skirt and freshwater lens concepts with smart lighting and feeding for improved lice prevention and fish welfare, was trialed. Environment, lice levels and fish welfare were assessed. In addition, acoustic tags and echo sounders were used to track fish behaviour. An associated laboratory trial on brackish water salinity effects on host-attached salmon lice was also conducted. We found that within the interval standard skirt and freshwater lens skirt cages were fully-functioning, there was no significant effect on lice levels or fish welfare. Fish behaviour monitoring found variable use of the freshwater lens, though night lighting appeared to increase fish residence in the low salinity space provided. From this work an ultimate conclusion on the effectiveness of this technology cannot be drawn, but it is clear that a less saline brackish water is needed in combination with higher residence time of the fish to have a substantial reducing effect on lice levels on caged salmon. The lab scale trial suggested that to delay host-attached lice development < 12 ppt is required and to kill host-attached copepodids < 4 ppt is needed over durations of 3 hours or more.
1 - Introduction
Methods for salmon lice control in Norwegian Atlantic salmon farming have shifted from chemical treatments towards mechanical treatments that involve intensive fish handling and risk of impaired fish welfare (Overton et al. 2018). To counter this, a range of techniques that seek to prevent lice attachment and development with minimal fish handling have been developed. These include cage designs or salmon behaviour manipulations ensuring salmon avoid contact with mostly surface-dwelling salmon lice larvae (Bui et al. 2017). They encompass submerged cages, submerged cages with inbuilt air domes, snorkels, skirts, semi-enclosed cages and deep-lighting and deep-feeding in standard cages (Bui et al. 2017) or closed cages (Nilsen et al. 2017). Skirt cages use a simple and effective cage modification – a tarpaulin wrapped around upper cage depths – and are the most widely adopted preventive method within the Norwegian salmon farming industry. While lice reduction effects of skirt cages have been observed at 80% compared to unprotected control cages (Grønvedt et al. 2018, Stien et al. 2018), salmon are still exposed to a dampened level of infective lice larvae that are present deeper in the water column under a halocline or during vertical mixing, or within the skirt due to hydrodynamic forcing. Skirts can also compromise oxygen levels in situations where salmon crowd within them (Stien et al. 2012). The combined use of skirts with deep night lights to keep salmon deeper is likely to strengthen lice reduction effects and improved cage environment conditions.
Creating a permanent freshwater surface layer in a restricted space within cage environments (e.g. Wright et al. 2017) has been proposed as a potential avenue for ceasing lice colonisation on farmed salmon. Attached lice are most vulnerable to fresh- and brackish water when they first settle on fish hosts in the copepodid stage, and reduced survival has been found after a 1 h freshwater exposure, in vivo (Wright et al. 2016). Therefore, salmon regularly exposing themselves to a fresh- to brackish water surface layer in cages, particularly during surface jumps for swim bladder re-inflation, feeding events and at night, may shed newly-attached copepodids. Initial testing suggests that motivational factors are required to increase salmon residency times in a freshwater surface layer to deliver lice reduction effects (Wright et al. 2018). Firstly, stimulation by temperature and/or light gradients in addition to feeding may increase freshwater use by salmon and effects on lice levels (Oppedal et al. 2011). Secondly, a more brackish rather than freshwater surface layer may drive greater salmon presence.
To date, large scale experimental work covering the prophylactic use of brackish water has either been very short-lived or only attempted in the full volume of the salmon pen. Considering the high cost of producing freshwater, and the potential preventive effect from brackish water exposure, work is warranted to document the effect of adding relatively small amounts of freshwater which is subsequently maintained as a stable brackish water body in a designated area in the pen. However, further testing is required to examine the specific effects of brackish water salinity exposures, particularly those that are likely delivered from a small space in cages, on salmon lice development and survival. Although past work has addressed aspects of brackish salinity effects on salmon lice (Johnson & Albright 1991; Tucker et al. 2000; Bricknell et al. 2006), a significant knowledge gap still, is brackish salinity effects on copepodids which have established on Atlantic salmon (e.g. 1-day post infection at 12°C, as in Wright et al. 2016).
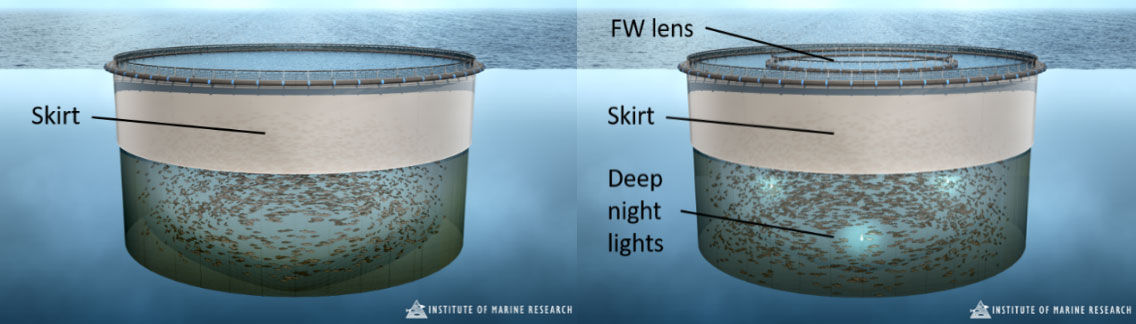
The use of a new prophylactic “well” cage design combining a skirt and fresh- to brackish water lens with smart lighting and feeding (Figure 1) could enhance lice prevention and uphold fish welfare in salmon sea-cages. Firstly, a lice skirt and predominantly deep night lights is designed to minimise initial encounters between salmon and free-living copepodids. Secondly, a FW-lens which salmon are motivated to enter by controlling its temperature (by pumping water of preferred temperature for salmon thermoregulation – closest to 15°C – into a reverse osmosis desalination unit), and periodically feeding in and illuminating the space, is designed to limit further colonisation of any attaching copepodids. Thirdly, a general pattern of deep-swimming by salmon via night lights positioned mostly in deeper water and absence of feed in the volume between lice skirt and FW-lens is intended to improve oxygen conditions within the enclosed upper skirt zone. Along with the skirt cage design, the more advanced “Well” cage incorporates lice prevention methods avoiding fish handling and aligning with prevailing salmon sea-cage rearing needs.
2 - Methods
We took a two-pronged approach to investigate “well” cage effects on salmon farm management with a focus on salmon lice control. Firstly, we conducted a large commercial-scale trial using standard skirt and “well” skirt cages (referred to as well cages hereafter), tracking salmon lice levels, fish welfare status, growth and mortality, and general farm management practices over a 10-month period. We also measured variation in brackish salinities within freshwater lens pool via remote sensors in well cages, as well as the nature and duration of brackish salinity exposures within this pool by Atlantic salmon. This included testing whether smart use of underwater lighting could enhance fish residence inside the freshwater lens pool of well cages. Fish behaviour was measured via externally-attached fish tags recording salinity along with echo sounders recording fish biomass and depth distribution inside the freshwater lens pool.
Secondly, in controlled laboratory experiments we studied the effects of brackish water salinity exposures, used in the freshwater lens pool, on the most freshwater-sensitive host-attached salmon lice stage – the copepodid stage (Wright et al. 2016). The salinity tag data acquired from the commercial well cage trial informed the types of brackish salinity exposures selected in laboratory experiments.
2.1 - Commercial trial using “well” cages
2.1.1 - Trial design and long-term monitoring
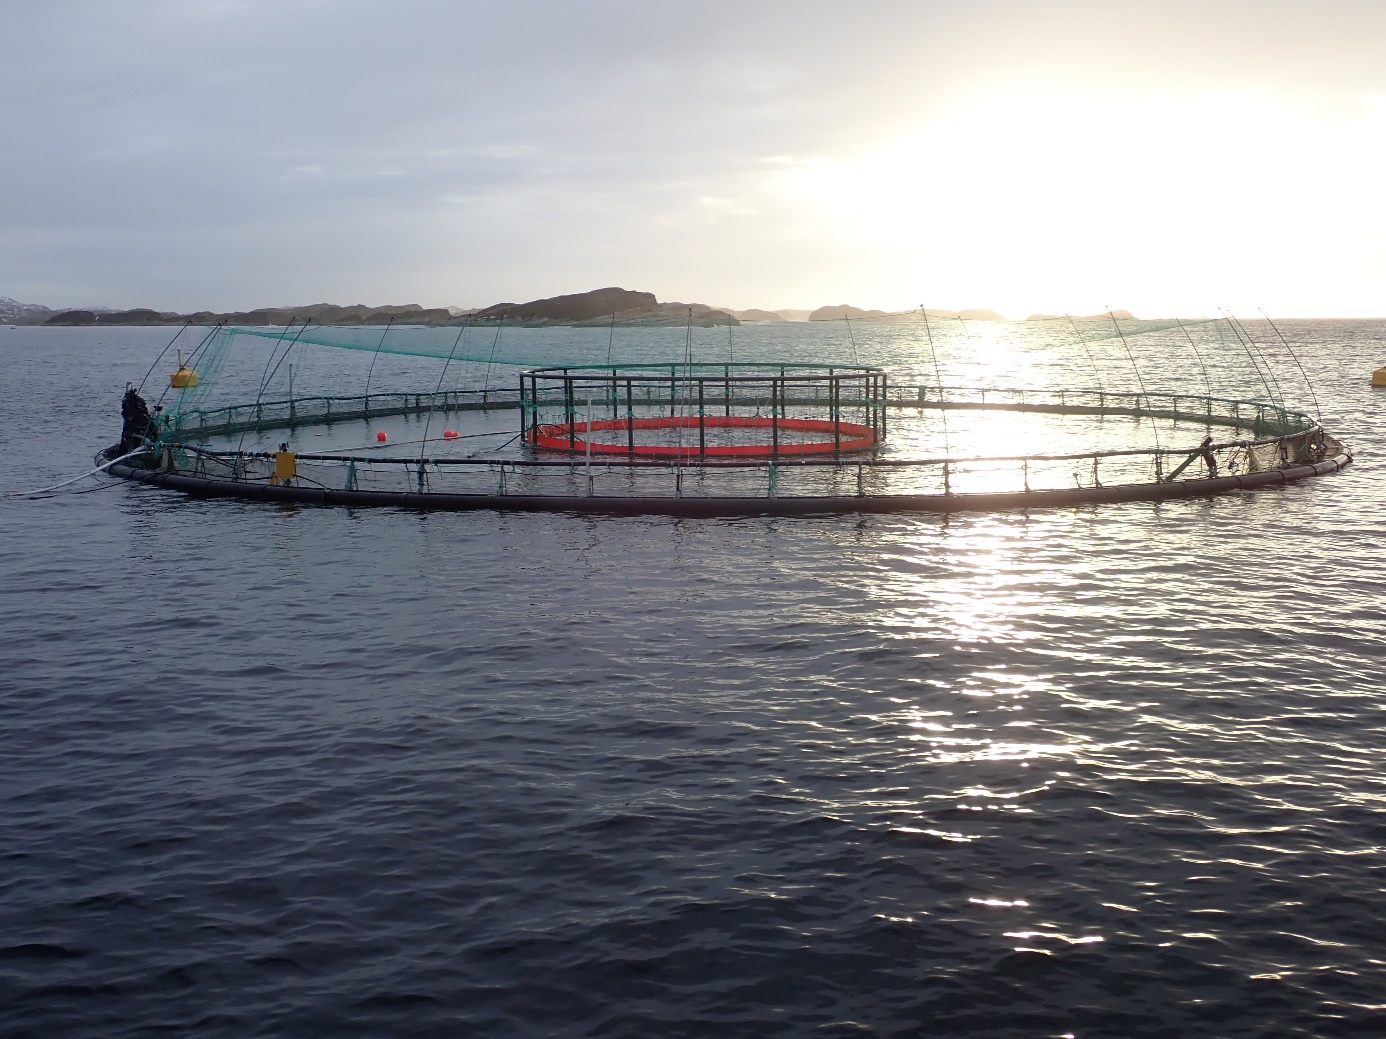
At the Haverøy salmon farm (Fjell commune, southwest coast of Norway), with no naturally occurring brackish water layer, 4 × 160 m circumference study cages were assigned. Two were set up as traditional skirt cages and two had the well cage setup (Figure 1, front page upper photo). These were monitored for most of a production cycle from November 2017 to October 2018 (approximately 1.5 kg to harvest size). All cages had 6 m deep outer tarpaulin skirts installed and held the same numbers of lice-eating cleaner fish and salmon. Well cages had additional deep lights (3 x 1000W light units hung at 10 m depth) along with an impermeable central inner tarpaulin of 6 m depth and 16 m diameter (≈1190 m3) containing the freshwater lens. Inside the freshwater lens a dimmable 400W light was placed at 1 m depth, and could be used to attract fish into the fresh-to brackish water layer. Feed was delivered via a standard surface feed spreader in all cages. However, the air pressure used in the surface spreaders within well cages was adjusted so feed was either spread within or beyond the inner skirt diameter, depending on whether feeding rates or salmon motivation inside the FW lens pool needed to be maximised.
The inner tarpaulin was continuously filled with freshwater from a reverse osmosis desalination unit (RO) positioned at the feed barge, which created a brackish water surface layer down to approximately 10 ppt at 1 m depth. The water intake depth was modified so that the water temperature inside the FW lens pool was closest to the thermal optimum of Atlantic salmon (closest to 15°C) in order to stimulate brackish water salinity use. Desalinated water at 0.5-3 ppt was pumped at a rate of 600–800 m3 per day per pen leading to a water exchange rate of some 50% per day in the FW lens pool. Depending on oxygen conditions (monitored at 3 depths inside the freshwater lens), there was the option to increase water exchange or super-oxygenate the RO-water. It should be noted that, due to operational problems with RO water production, salinity reductions inside the FW lens pool varied substantially during the study.
Lice levels (at copepodid, chalimus 1, chalimus 2, preadult 1, preadult 2 male, preadult 2 female, adult male, adult female, adult female with eggstrings), fish welfare status (Salmon Welfare Index Model or SWIM version 1.1, Stien et al. 2013) and amoebic gill disease (AGD) related gill scores (based on scoring used in Taylor et al. 2009) were recorded every 4 weeks and environmental conditions at a reference location was also monitored daily using a conductivity temperature depth (CTD) device (SD208, SAIV-AS, Norway) to profile 40 m of the water column throughout the trial to explain variations in lice levels, fish welfare and fish depth distribution. Back-calculations of when different new lice stages (copepodid, chalimus 1, chalimus 2 and preadult 1 stages, expected to be unaffected by lice treatments and cleaner fish) infected fish were based on average water temperature recordings at 5 m reported to BarentsWatch (www.barentswatch.no/fiskehelse /locality/11740/) and development time (Hamre et al submitted).
Continuous wireless real-time environmental logging systems was also implemented in all 4 study cages. Each well cage was monitored for salinity and temperature at 1, 3 and 5 m depth inside the FW lens pool and outside it at 1 m depth. Standard skirt cages had continuous monitoring of temperature and salinity at the same outside FW lens pool location in well cages. In addition, information on general farm management was gathered during the trial, including the frequency and timing of parasite treatments against lice and AGD.
2.1.2 - Trial design and long-term monitoring
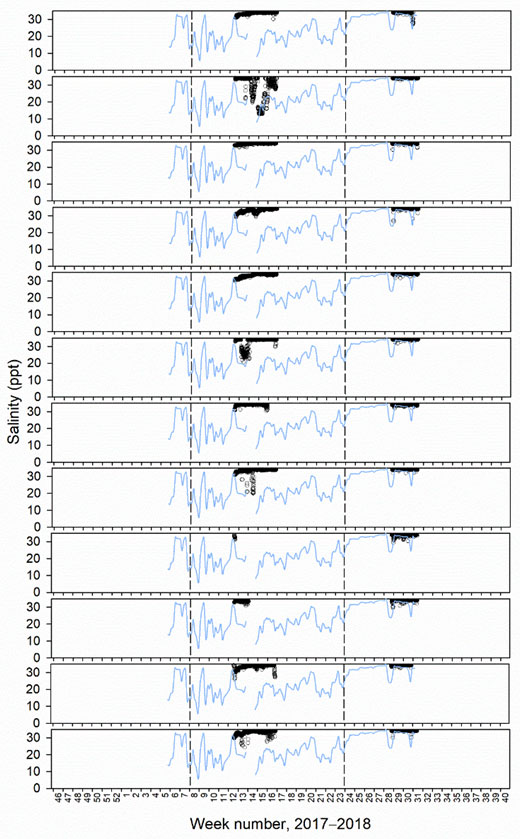
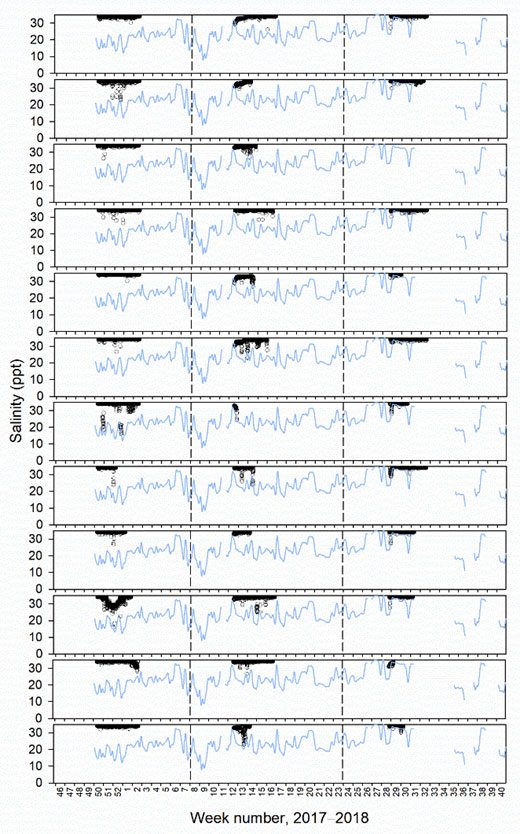
 For additional data on salinities experienced by fish in the 2 well cages, salinity and temperature histories of 12 “sentinel fish” in each cage were tracked by fitting them with acoustic salinity tags (V9-CondTag, 69kHz, battery life 90 days, Thelma Biotel, Norway) next to dorsal fin (see left photo) and receiving signals at an upper and lower receiver in each cage (2 acoustic receivers, see right photo). This was repeated 3 times (December 2017, and March and July 2018) so salinity data could be gathered throughout the trial (12 fish × 2 cages × 3 times = 72 acoustic tags). However, only 12 fish were tagged in one well cage at the first deployment because the other did not have a skirt or a freshwater lens pool. Salinity tag data were selected to cover a 1-month period after tag deployments, wherein recordings were deemed to be most reliable, before the salinity sensor eventually degraded over time in seawater. Recordings were further filtered to remove erroneous values that fell well outside the known salinity and temperature within the cage environments, and also those that were only rarely recorded after a tag had appeared to go missing either due to fish mortality, tag rejection or tag malfunction. We also condensed 10-minute interval recordings into average hourly values so that we could better track whether fish were within the freshwater pool for periods sufficient to affect lice levels (see the controlled laboratory experiments for details).
2.1.3 - Trial design and long-term monitoring
An echo sounder system was installed in one well cage from 4?24 October 2018 (see CageEye 2018). A 50 khz upward facing transducer was cabled to a CageEye echo sounder box mounted to the cage edge that wirelessly communicated with a PC (cageeye.no). The transducer was centrally positioned at 20 m depth within the freshwater lens pool, and measured fish biomass (total echo strength) and fish depth distribution between 0.25−18 m depth. Approximately halfway through this monitoring period, 1 × 400W underwater anti-maturation night light was placed within the freshwater lens pool at 1 m depth and turned on in an attempt to further motivate fish into the surface brackish water layer. When comparing before vs during periods of night lighting, only times of surface brackish water layer presence were included. We also split data between day and night periods based on mean local sunrise and sunset times (08:15 and 18:31) so that night time salmon depth behaviour could be distinguished.
2.2 - Lab testing of brackish salinity effects on host-attached lice
At the Havforskningsinstituttet (HI) research station in Matre, a lice hatchery was set up. This involved using infective copepodids, developed from salmon lice eggstrings collected from the HI research salmon farm at Austevoll, to infect groups of Atlantic salmon. Eggstrings from adult female lice developed from original collections were then continually collected from salmon following a light anaesthetic dose (metomidate 10 mg L-1) throughout April–May 2018. Egg strings and planktonic larval stages were incubated at 15 °C in flow-through plastic box units with 150 μm mesh (e.g. Hamre et al 2009).
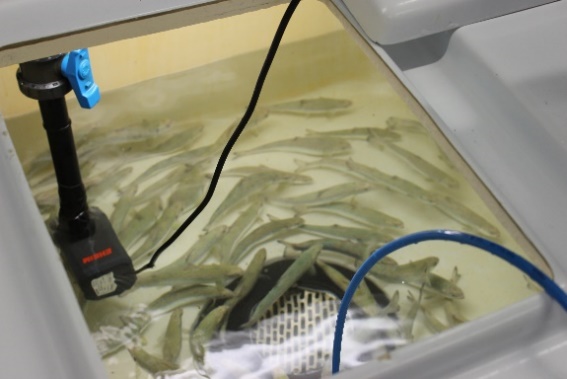
Each trial week, 4 groups of Atlantic salmon post-smolts (32–33 for single and 26–27 for repeat exposures, see right photo) held in 320 L holding tanks at 15 °C were infected by adding 1971 ± 303 copepods (~2 days post-moult). The infection protocol involved stopping incoming flow, reducing the water level to 20 cm, and then adding lice and allowing their attachment under no flow for 20 min with aeration and scaring fish every 5 min by waving above the tank. Once the 20 min period elapsed, low flow began at 2 L/min for an additional 40 min to refill tank. At this point, full flow was reset (20 L/min) and flow through commenced.
2.2.1 - Single exposures
In a first experiment, single exposures were tested. In one of 4 trial weeks, one of the 4 brackish salinity levels (4, 12, 19, 26 ppt) was tested over 4 single exposure durations (3, 9, 24 and 72 h) in a fully crossed design. The order of salinity levels tested each week were randomised. At 1-day post infection (1-DPI) in the 4 aforementioned infection tanks, 2 fish from each tank were placed into each of 15 other treatment tanks after a light anaesthetic dose, leaving a total of 8 infected fish in each treatment tank. Three treatment tanks held 34 ppt, and 12 held brackish salinity water at the appropriate level. In groups of 3 replicate treatment tanks, fish added to the brackish salinity water were switched to full seawater (34 ppt) after the four exposure durations, while no further action was taken for fish in 3 treatment tanks initially at full seawater (control or 0 h exposure duration). This salinity change protocol resulted in fish being exposed to an initial rapid salinity decrease, followed by a more gradual salinity increase to full seawater.
2.2.2 - Repeated exposures
 In a second experiment, repeated exposures were tested. Fish were repeatedly exposed to 4, 12 and 19 ppt for either one, two or three 1 h exposures per day (with 1 h of full seawater exposure in between exposures within a day) over 3 consecutive days. Again, one salinity level was tested each trial week in random order over 3 weeks. Only 12 treatment tanks were used, with each stocked with 8 infected fish in the same fashion as for single exposures. As before, 3 treatment tanks were at 34 ppt as fish entered them as controls. The remaining tanks were at the appropriate brackish salinity as fish entered and raised to full seawater after 1 h as previously described. To conduct additional exposures, header tanks were set to the required salinity (for tanks requiring exposures) and tanks were dropped to 10, 20 or 30 cm for the 4, 12 and 19 ppt treatments, respectively. Freshwater (1 ppt) was then pumped from storage tanks with a 120 min/L pump to fill the brackish salinity tanks or full seawater was pumped into lowered control tanks (controlling for any effect of water level manipulation on lice levels). This procedure was used to drop the salinity level quickly. Raising the salinity to seawater again after 1 h was performed as previously described.
To assess lice levels fish welfare, we lightly sedated fish with metomidate (10 mg L-1) and destructively sampled all eight fish from each tank at 6-dpi. Lice were counted and staged, and the length, weight and condition of each fish was recorded (see right photo).
3 - Results
3.1 - Commercial trial using “well” cages
3.1.1 - Cage environment and lice levels
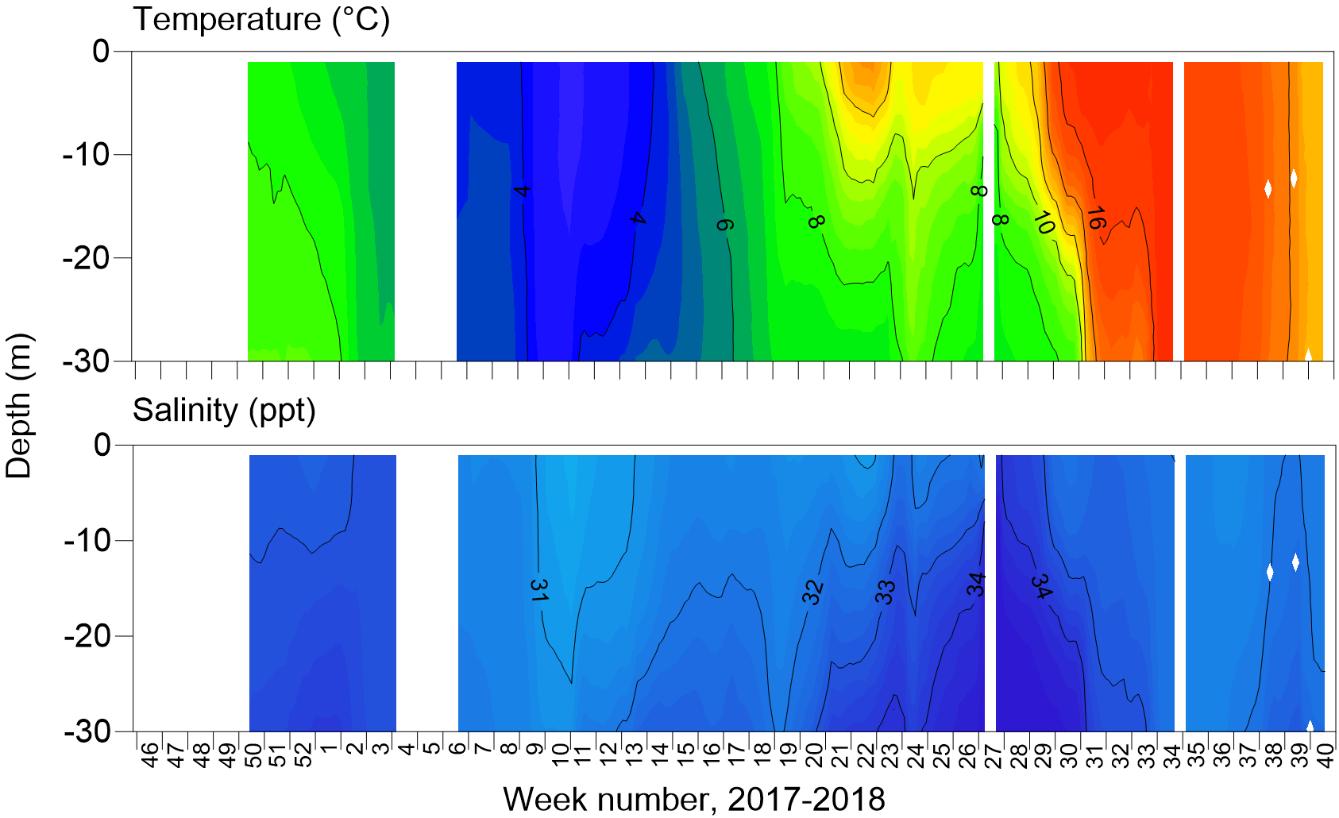
During the trial of well and standard skirt cages, temperature varied between 2.6−18.0 °C, with occasional strong vertical gradients over spring to summer where overlying warmer water persisted (Figure 2). No strong vertical gradients in salinity were evident, and levels remaining within 28.1−35.0 ppt (Figure 2).
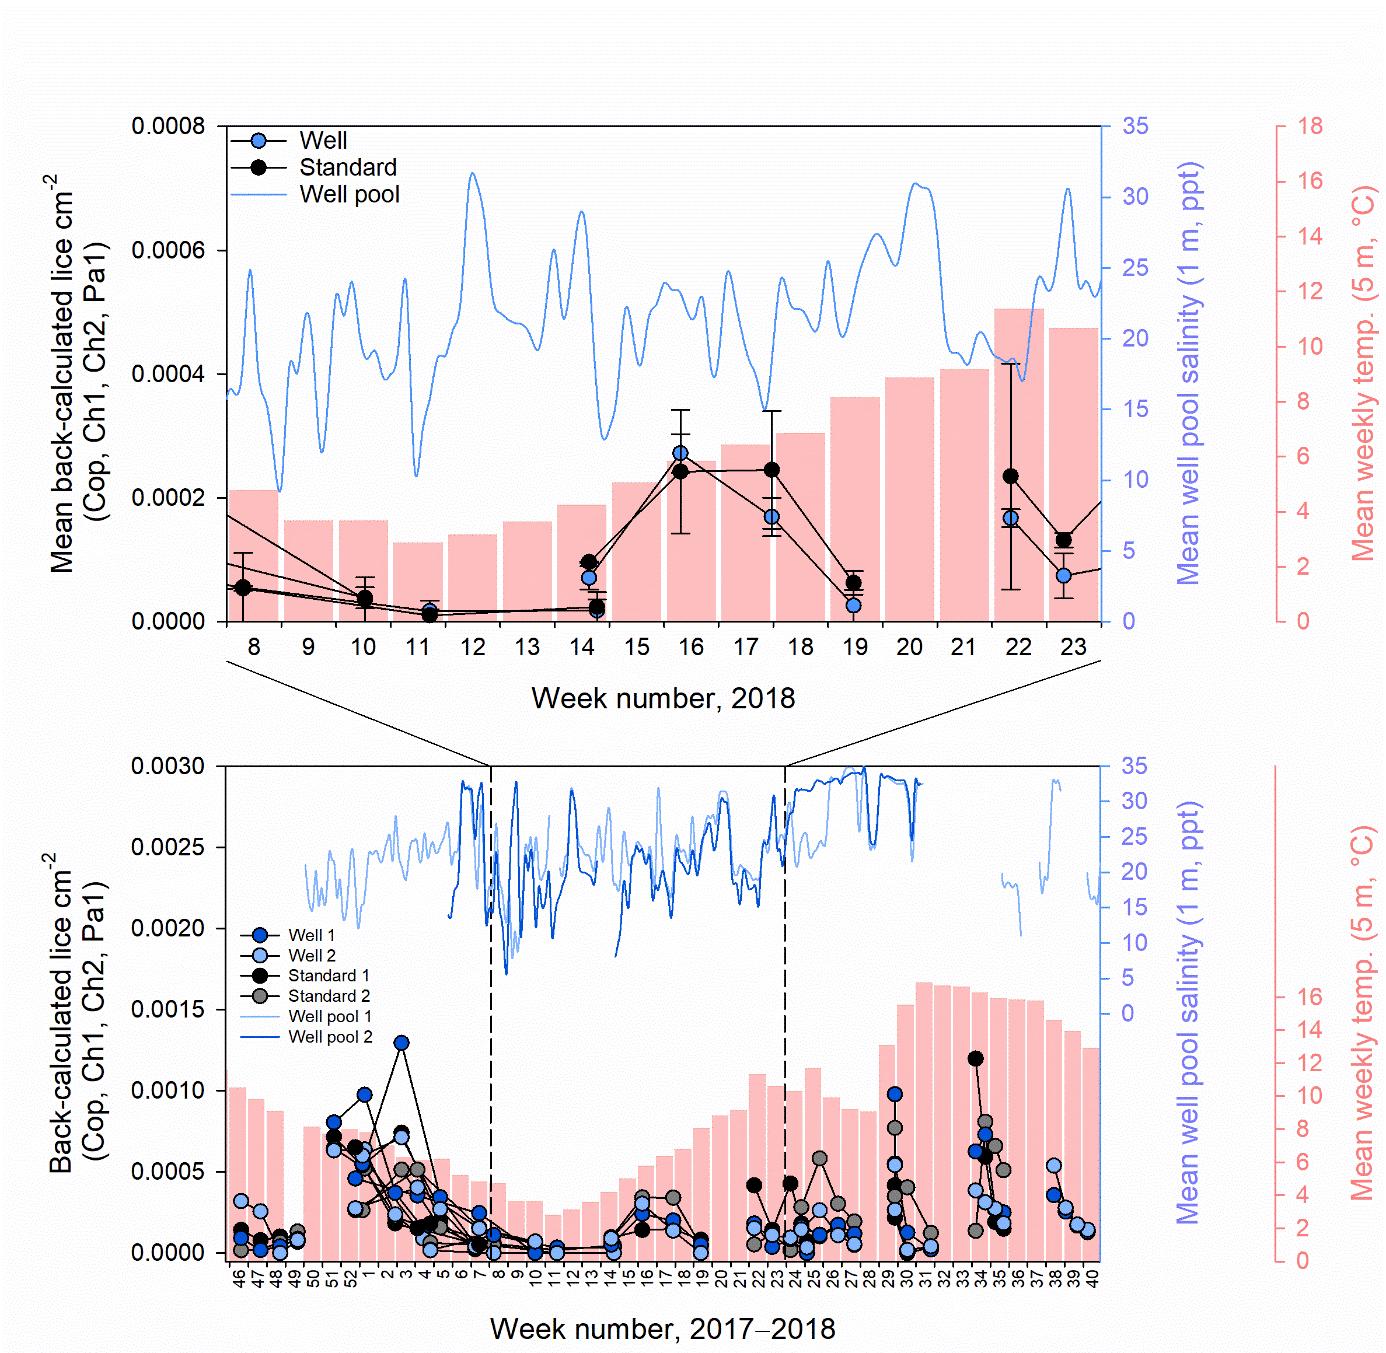
Despite the intention for well and standard skirt cages to be deployed from November 2017 until October 2018, there were gaps in their complete operation. From December 2017 to January 2018 only well cage 2 had a skirt deployed, while skirts were removed in all other cages due to gill disease outbreaks (Figure 3). In addition, between mid November 2017 to February 2018 and June to October 2018 well cage 1 did not have a freshwater lens pool (Figure 3). Reasons for the lack of freshwater lens deployment in well cage 1 included initial malfunctioning of the inner skirt which did not hold a stable brackish layer, with subsequent re-design of new inner skirts for both well cages. Then, after functioning for some months, reductions in desalinated water supply occurred owing to filter blockages from algae, preventing freshwater production by RO. This meant that comparisons of lice levels, fish welfare, and farm management practices between well and standard skirt cages were best assessed between a defined study period from March to May 2018 (weeks 8 to 23, 2018, Figure 3).
In the defined study period, mean salinity at 1 m inside the freshwater lens pools of well cages 1 and 2 was 21.4 ppt, and ranged from 9.6 to 31.0 ppt (Figure 3). Individual freshwater lens pools had minimum peaks as low as 6.1 and 7.9 in well cages 1 and 2, respectively (Figure 3). Lice stages calculated to have attached to fish during the defined study period, based on temperature-dependent development rates, were at similar levels between well and standard skirt cages (mean ± SE of 0.00009 ± 0.00002 and 0.00011 ± 0.00003 lice cm-2 respectively or 0.19 ± 0.05 and 0.14 ± 0.03 lice fish-1, Figure 3). The range of lice fish-1 of a particular stage in an individual cage in the defined period was 0−0.7.
3.1.2 - Cage environment and lice levels
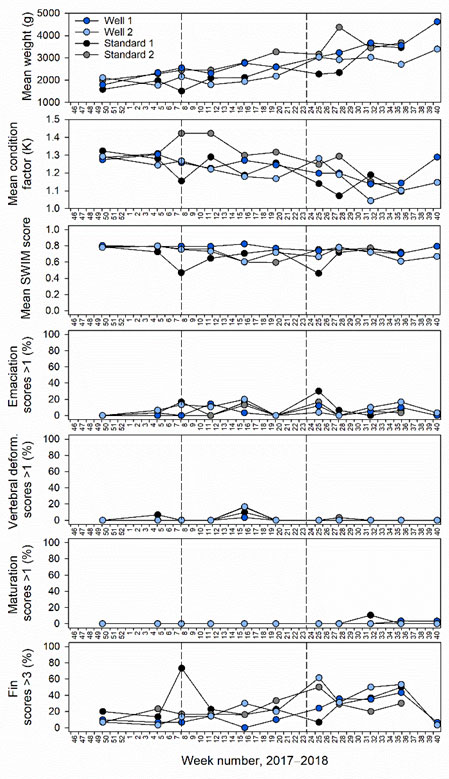
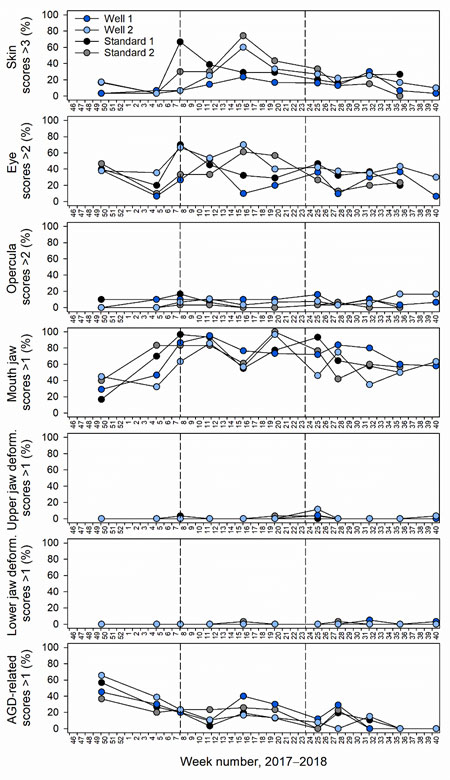
When scrutinising weight, condition and SWIM scores during the entire trial, weight and condition appeared to be slightly reduced in well cage 2 which had a freshwater lens pool operated most continuously over the entire trial (Figure 4). Decreases in weight and condition, along with the most significant deviations from normal overall SWIM scores, were also observed in standard skirt cage 1 after thermolicer treatments on weeks 7 and 23, 2018 (Figure 4). Particularly severe eye, fin, skin and mouth jaw damage was recorded in this cage at week 8, 2018 after a thermolicer treatment at the coldest time of year (Figure 4).
Fin, skin, eye and mouth jaw damage appeared to increase during the initial phase of the trial, and then recover just prior to harvest (Figure 4). Vertebral and upper and lower jaw deformities as well as sexual maturation were mostly undetected (Figure 4). Deviations from normal smoltification status were also absent. Opercula damage was found during the trial, but remained less at percentages < 20% (Figure 4). Emaciation was detected to some degree throughout the trial, except at the sampling point 1 (Figure 4). Severe amoebic gill disease (AGD) related scores were observed early in the trial (December 2017), but later recovered (Figure 4). Interestingly, AGD-related scores recovered in well cage 2 which was fully functioning with a skirt and freshwater lens throughout the beginning of the trial (Figure 4). During this period, all other cages had an AGD treatment and skirts removed to combat poor gill health (Table 2).
Table 1. Mean weight, condition factor and SWIM score along with percentages of deviations in individual SWIM indicators at sampling 6, at the end of the defined study period in which standard skirt and well cages were fully operational. Smoltification status is not included. AGD-related gill scores, which contributed to the gill damage individual welfare indicator, are displayed as these more likely measured effects of freshwater lens pools on gills.
|
Parameter |
Well cage |
Standard cage |
|
Mean weight (g) |
2381.7 ± 203.3 |
2930.0 ± 335.2 |
|
Mean condition factor (K) |
1.20 ± 0.04 |
1.29 ± 0.03 |
|
Mean SWIM score |
0.74 ± 0.02 |
0.67 ± 0.07 |
|
Emaciation scores >1 |
0.0% |
0.0% |
|
Vertebral deformity scores >1 |
0.0% |
0.0% |
|
Sexual maturation scores >1 |
0.0% |
0.0% |
|
Fin scores >3 |
15.0 ± 5.0 |
28.0 ± 5.4 |
|
Skin scores >3 |
25.0 ± 8.3 |
36.2 ± 7.2 |
|
Eye scores >2 |
30.0 ± 10.0 |
42.8 ± 13.8 |
|
Opercula scores >1 |
8.3 ± 1.7 |
0.0% |
|
Mouth jaw scores >1 |
85.0 ± 11.7 |
88.7 ± 11.3 |
|
Upper jaw deformity scores >1 |
0% |
1.7 ± 1.7 |
|
Lower jaw deformity scores >1 |
0% |
0% |
|
AGD-related scores >1 |
21.7 ± 8.3% |
18.1 ± 5.2% |
At the last sample within the defined study period, when well and standard skirt cages were functioning, fish weight and condition factor were reduced in well relative to standard cages (Table 1). No clear difference in overall SWIM scores were observed between cage types. Emaciation, vertebral or lower jaw deformities or sexual maturation were absent (Table 1). Minor levels of opercula damage in well cages only and upper jaw deformity in standard skirt cages only were observed (Table 1). Moderate fin, skin and eye and severe mouth jaw damage was found in well and standard skirt cages, however were slightly reduced fin damage was evident in standard skirt cages (Table 1). Moderate AGD-related gill scores were found at similar levels in well and standard skirt cages (Table 1).
3.1.3 - Cage environment and lice levels
In autumn 2017, all cages except well cage 2, which had a functioning freshwater lens pool, had skirts removed and a freshwater treatment in response to an AGD outbreak (Table 2). During winter−spring 2018, all cages had thermolicer or optilicer treatments against lice, however standard skirt cage 2 required two optilicer treatments and well cage 2 only required a delayed initial optilicer treatment on week 14, 2018, compared to first treatments in other cages from weeks 7−11, 2018 (Table 2). Over the entire trial, when discounting treatments after splitting or harvest of some cages towards the end of production, well cage 2 also had less lice treatments than other cages (2 vs 3?5 treatments, Table 2). However, this difference was likely linked to the use of a skirt for a longer period of the production cycle in this cage in the initial phase of the trial, due to poor gill health in other cages. In contrast, when all treatments in the production cycle were included, over the varying times, well cage 2 lice treatments were of similar frequency to other cages (4 vs 3−5 treatments, Table 2).
Table 2. Parasite treatment type, timing and frequency in individual cages during the well trial. Shaded cells indicate times after which cages began to be split (orange) or harvested (red). Lice treatment frequency values are coloured when including treatments after cages began to be split (orange) or harvested (red).
|
Timing |
Well cage 1 |
Well cage 2 |
Standard cage 1 |
Standard cage 2 |
|
Week 47, 2017 |
AGD freshwater |
|
AGD freshwater |
AGD freshwater |
|
Week 7, 2018 |
|
|
Thermolicer |
Optilicer |
|
Week 11, 2018 |
Optilicer |
|
|
|
|
Week 14, 2018 |
|
Optilicer |
|
Optilicer |
|
Week 23, 2018 |
|
|
Thermolicer |
|
|
Week 24, 2018 |
|
|
|
Optilicer |
|
Week 26, 2018 |
Optilicer |
|
|
|
|
Week 27, 2018 |
|
Thermolicer |
|
|
|
Week 29, 2018 |
|
|
|
Optilicer |
|
Week 31, 2018 |
|
|
Hydrolicer |
|
|
Week 32, 2018 |
Hydrolicer |
|
|
|
|
Week 33, 2018 |
|
|
|
Lice freshwater |
|
Week 35, 2018 |
|
Hydrolicer |
|
|
|
Week 39, 2018 |
Thermolicer |
Thermolicer |
|
|
|
AGD treatment frequency |
1 |
0 |
1 |
1 |
|
Lice treatment frequency |
3 (3 4) |
2 (3 4) |
3 (3 3) |
5 (5 5) |
3.1.4 - Cage environment and lice levels
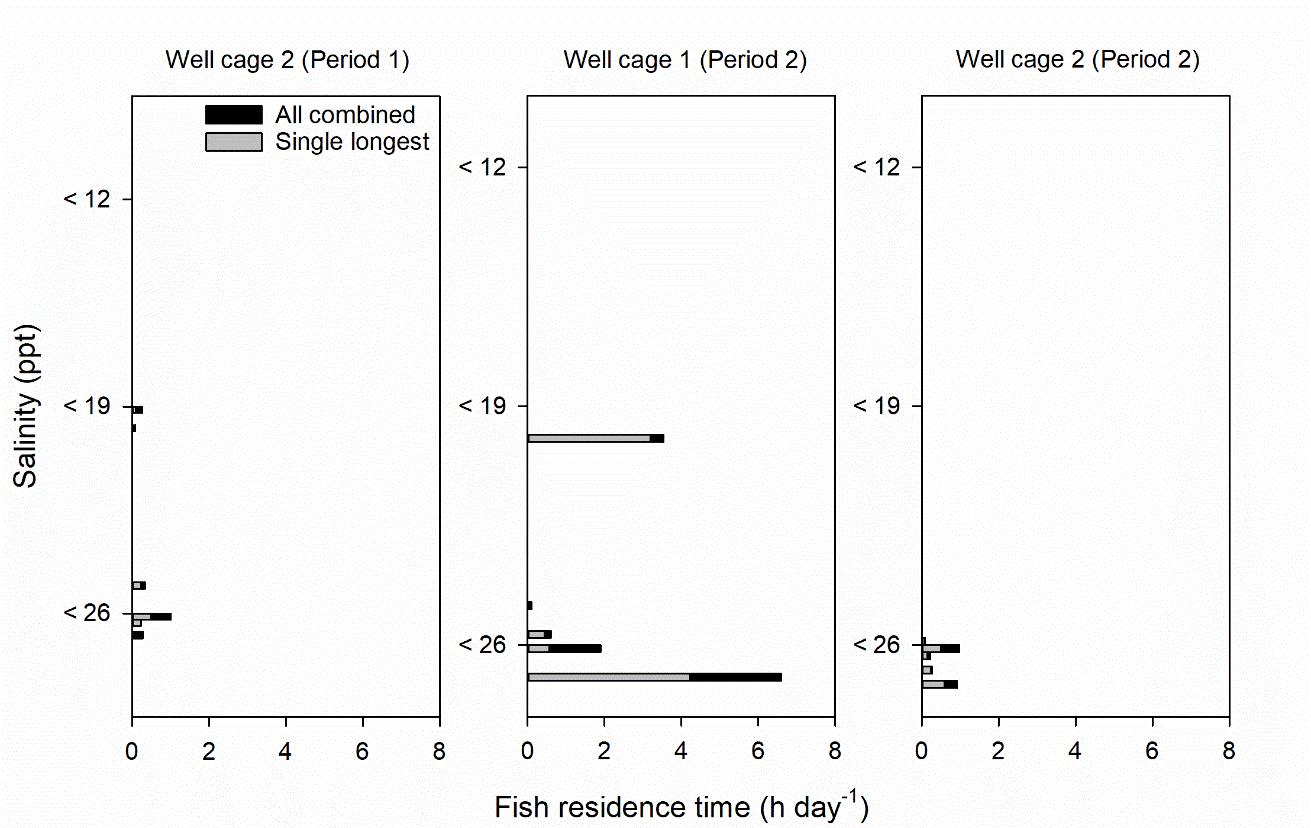
Salinity tags mounted to fish never recorded mean hourly salinities < 12 ppt. Mean hourly salinities of < 19 and < 26 ppt were only recorded in tagging periods 1 and 2, as limited freshwater supply led to mostly full seawater salinities in the freshwater lens pools of well cages in tagging period 3 (Figure 5−7, Table 3). In period 1, 16 and 33% of tagged fish in well cage 2 resided in water of < 19 and < 26 ppt, respectively. In period 2, 8 and 33% of tagged fish in well cage 1 and 0 and 42% of tagged fish in well cage 2 were within salinities of < 19 and < 26 ppt, respectively (Figure 5−7).
The duration of fish residence in these salinities was a mean of 0.1−1.9 h day-1, except for one individual which had a mean fish residence time of 4.2 and 6.6 h day-1 at salinities < 19 and < 26 ppt, respectively (Figure 5−7). However, this was dominated by an extended single exposure for 96 h at < 19 or 127 h at < 26 ppt (Figure 5 and 6). This fish was monitored in the well cage and period with the lowest daily salinity recorded in a FW lens pool during salinity tag deployment (Table 3).
Table 3. Summary statistics of daily salinity at 1 m in the FW lens pool of well cages during fish tagging periods 1 (December week 50, 2017 – January week 2, 2018), 2 (March week 12 – April week 17, 2018) and 3 (July week 28 – August week 32 2018).
|
Daily salinity (ppt) at 1 m in FW lens pool |
Well cage 2 Period 1 |
Well cage 1 Period 2 |
Well cage 2 Period 2 |
Well cage 1 Period 3 |
Well cage 2 Period 3 |
|
Mean |
19.0 |
19.3 |
22.9 |
31.6 |
30.9 |
|
Minimum |
12.0 |
8.0 |
17.3 |
24.3 |
21.5 |
|
Maximum |
24.9 |
28.3 |
28.6 |
33.6 |
33.6 |
3.1.5 - Cage environment and lice levels
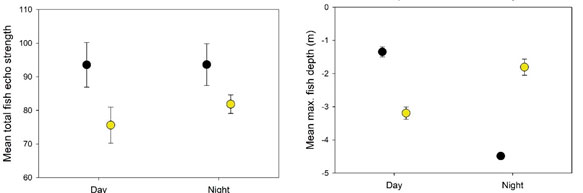
The depth band where the maximum fish percentage was recorded frequently occurred within the freshwater lens pool between 0.25−6 m before and during periods of night lighting (Figure 8 and 9). In the intervals analysed, salinities were 18.0 and 23.2 at 1 and 5 m before night lighting, and similarly 18.1, 19.8 and 24.3 at 1, 3 and 5 m during night lighting (Figure 8). At night, night lighting raised mean maximum fish depth from 4.5 m to 1.8 m depth into fresher salinities, but was associated with simultaneous decreased biomass in the central transducer beam (Figure 8 and 9). In daylight, fish were shallower and at greater biomasses in the freshwater lens pool before rather than during night lighting (Figure 8 and 9).
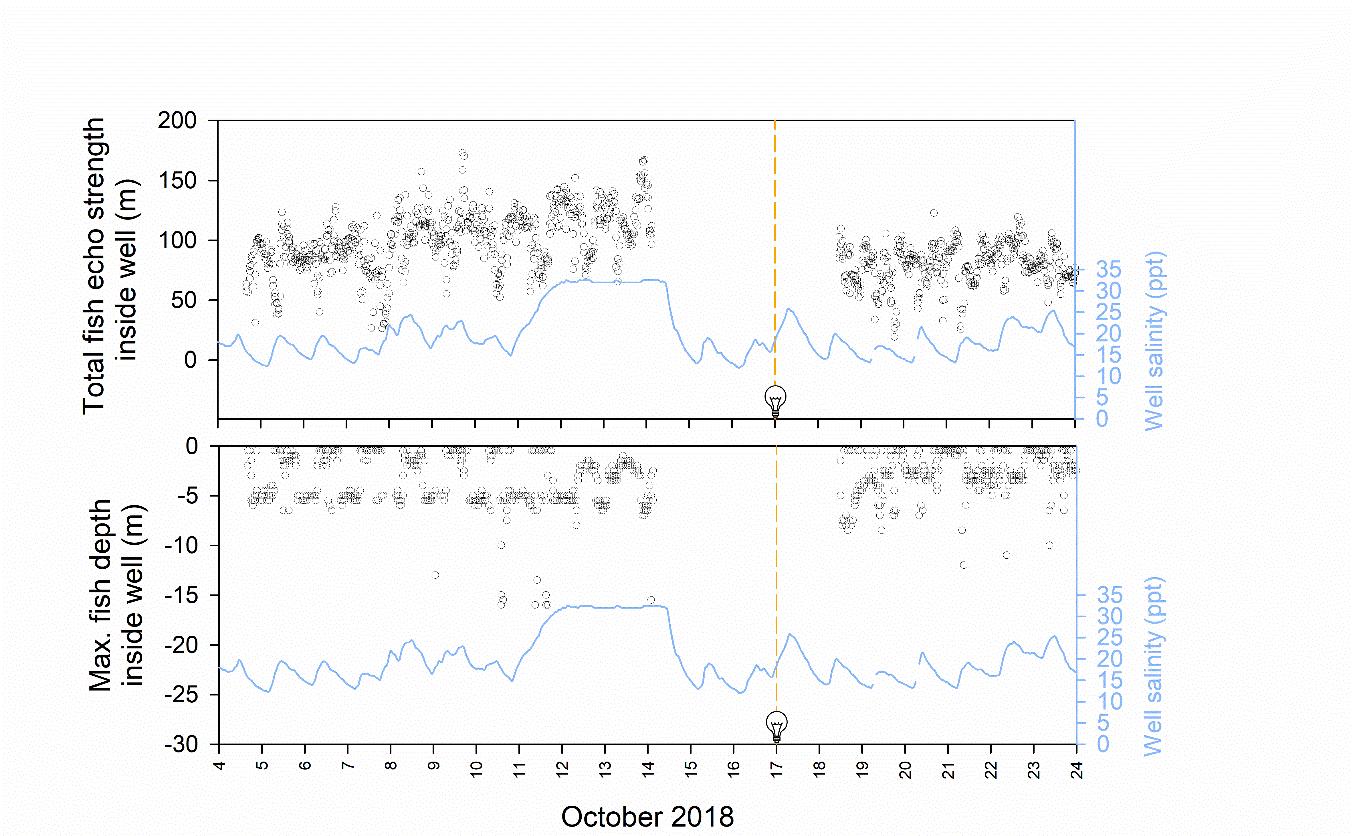
Figure 8. From the freshwater lens pool of a single well cage, measurements of total fish echo signal strength (top plot) and the depth band with the maximum fish echo signal strength (bottom plot, black open circles) plotted over time from 4–24 October 2018. Mean hourly salinity at 1 m within the freshwater lens well pool is also shown (blue lines). Lights within the well pool were installed from 17 October. Tick marks on the x axis are position at 0000 h.
3.2 - Lab testing of brackish salinity effects on host-attached lice
3.2.1 - Single exposures
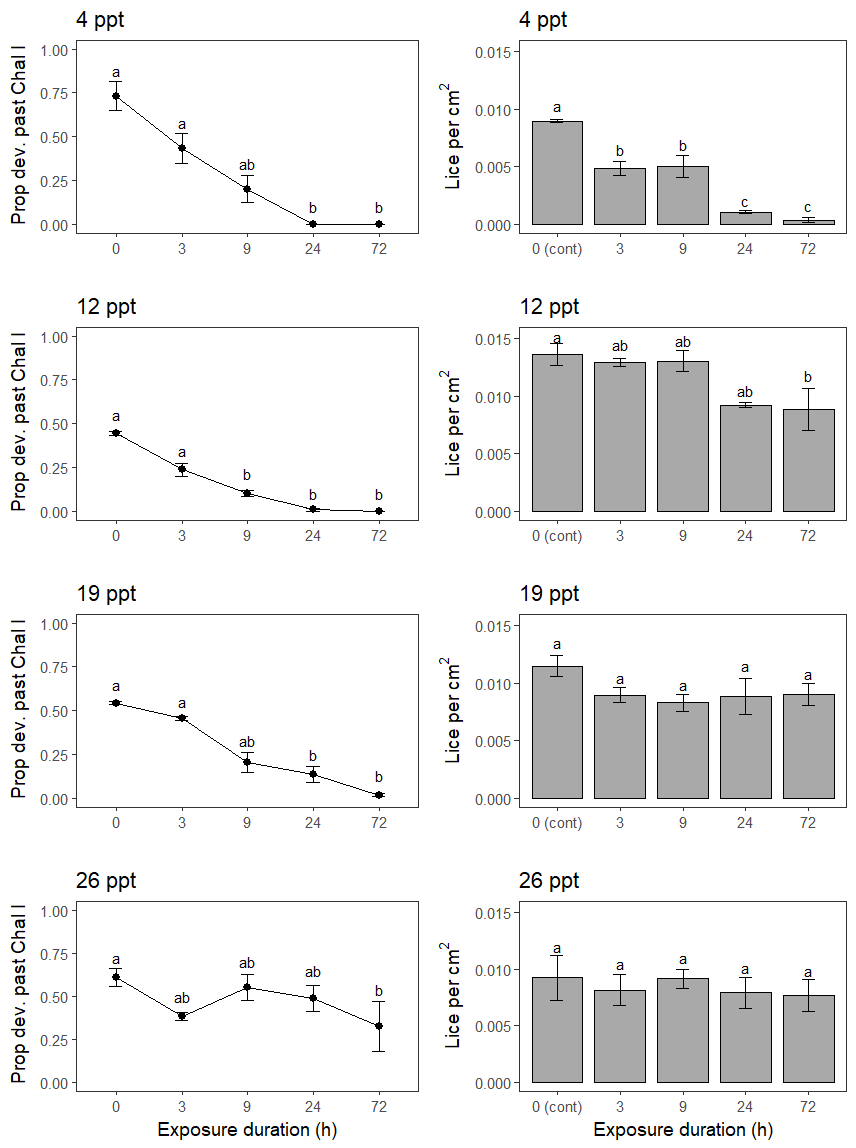
In the experiment testing single brackish salinity exposures on established copepodids on fish, the fish were 31.8 ± 0.1 cm in length and 315.6 ± 4.5 g in weight, and had good condition. A single exposure to 4 and 12 ppt affected lice numbers on fish, but 19 and 26 ppt did not (Figure 10). Increasing single exposure duration led to decreasing lice survival at 4 ppt, with survival reduced by 54, 56, 12 and 4% relative to controls for the 3, 9, 24 and 72 h exposures, respectively (Figure 10). At 12 ppt, survival was only lowered after 72 h exposure, however lice levels had decreased to a similar level after 24 h (Figure 10).
Lice development was also affected by single exposures, especially at 4, 12 and 19 ppt. Compared to controls, in which 44−73% of lice developed into chalimus II, only 2% developed this far after 24 or 72 h at 4 and 12 ppt, or at 72 h at 19 ppt (Figure 10).
3.2.2 - Repeated exposures
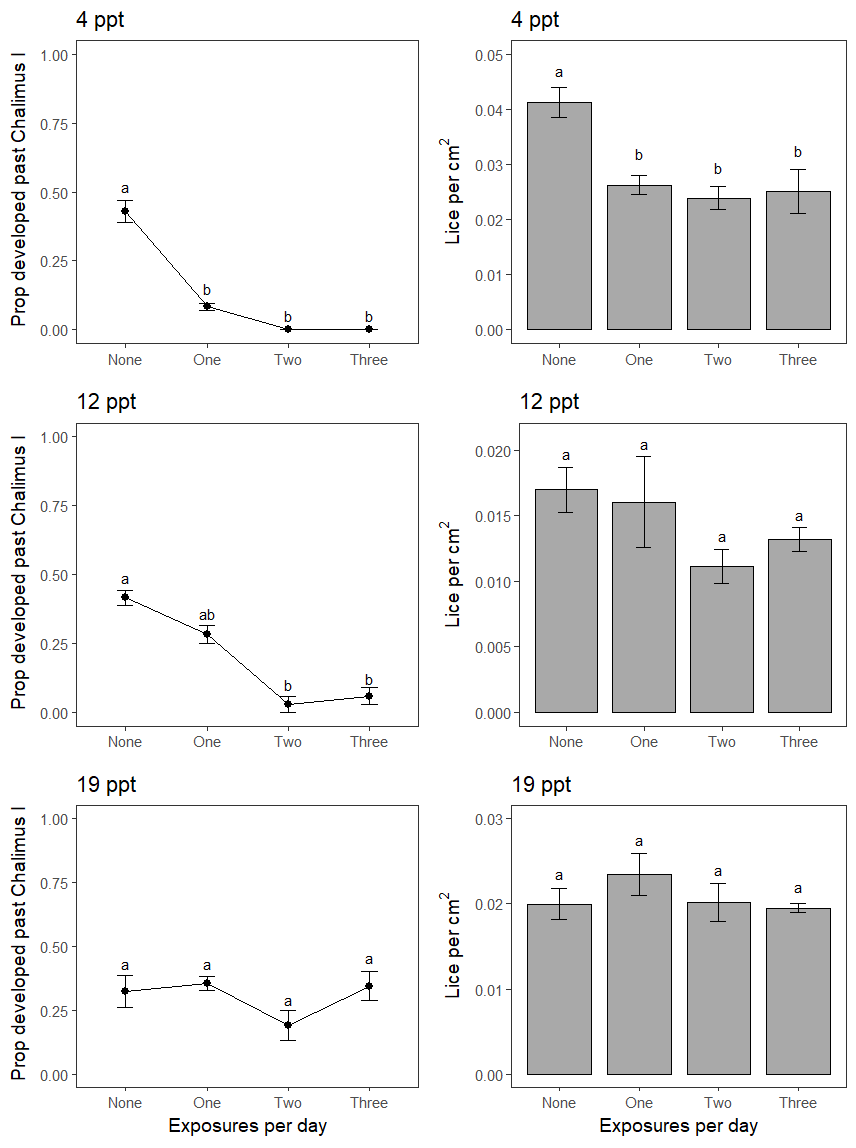
For the experiment testing repeat brackish salinity exposures on established copepodids on salmon, the fish were 23.1 ± 0.4 cm in length and 122.1 ± 6.2 g in weight, and in good condition. Repeated exposures at 4 ppt reduced lice numbers on fish, but increasing the number of exposures per day did not increase effects on survival (Figure 11). The tested repeat exposures at 12 or 19 ppt were ineffective at killing lice (Figure 11).
Repeated brackish salinity exposures delayed lice development at 4 and 12 ppt, but not at 19 ppt. Increasing the number of exposures per day did not appear to drastically strengthen effects on development rates (Figure 11).
4 - Discussion
Lice levels and the frequency of lice treatments were not found to be significantly lowered by the well cage design with a freshwater lens pool, in comparison to standard skirt cages in commercial salmon production at a coastal location. However, during an AGD outbreak, continued use of skirt lice barrier prevention technology and avoidance of an AGD treatment was linked to the operation of a well cage with a freshwater lens pool. Well cages did not appear to negatively affect fish welfare relative to standard skirt cages, and rather thermal delousing events drove episodes of poor welfare. Although, a reduction in growth and condition was observed during lice sampling in well compared to standard skirt cages, and may have been associated with limiting feed spreading to the inner freshwater lens pool of well cages in the first phase of the trial, fish growth was not different over the entire study period (Mowi, data not presented). Acoustic tag and echo sounder monitoring of fish behaviour confirmed that a portion of fish were residing in brackish salinities to some extent when they were continuously available in freshwater lens pools of well cages (Figure 12), and that night lighting may promote greater fish residency. However, lower salinity levels and longer or more brackish exposures by fish than those achieved in well cages in the current study will be required to impact on the most sensitive of host-attached lice stages.
The lack of effects on lice from operating well cages with freshwater lens pools was explained by fish behaviour, the cage environment and the brackish salinity exposure types required to impact on host-attached lice populations. From acoustic tag monitoring, only a portion of fish in well cages were using brackish water salinities of <19 or < 26 ppt at hourly timescales when continuously available in freshwater lens pools, and these episodes were generally short in duration (0.1−1.9 h day-1) and often involved single extended visits (e.g. > 72 h for one individual). No fish were found to experience < 12 ppt salinities at hourly timescales as these were rarely present in freshwater lens pools. However, laboratory testing of brackish salinity effects on the first and most freshwater-sensitive host-attached salmon lice stage (Wright et al. 2016) found that these salinities of ≤ 12 ppt are required to impact on lice survival over durations longer than 1 h. Although, it is worth noting that exposures to higher salinities of ≤ 19 ppt, particularly over long durations, which were experienced by one tagged individual in the current trial, appear to impact lice development. Lower salinities than those achieved in the current trial will be needed for freshwater lens technology to influence lice levels in commercial salmon cages. Furthermore, there is a need for fish populations be exposed more uniformly to brackish salinities, which may be achieved in cage designs where surface access is only possible through a brackish layer, such as freshwater snorkel cages (Wright et al. 2017, 2018).
A short-term pilot study using echo sounder monitoring, in which fish biomass and depth was monitored in a freshwater lens pool within one well cage, suggested that night lighting may increase fish residency in brackish salinities. The peak fish swimming depth was raised from 4.5 to 1.8 m into salinities between 18–19 ppt within a freshwater lens pool. Future work should test whether this effect holds in replicated longer term studies using lower salinities in a freshwater lens pool and testing over a range of environmental conditions. It is expected, for instance, light attraction will wane when salmon must trade-off between lit areas of sub-optimal temperature and unlit areas of preferred temperature (Oppedal et al. 2011).
Intriguingly, in the early phase of the trial a fully functioning well cage was able to retain its skirt lice barrier over the course of an AGD outbreak, while in other cages skirt removal and a freshwater AGD treatment was needed to cope with the outbreak. The ability to keep on the skirt within this well cage likely contributed to delaying its first lice treatment by 3−7 weeks. Lice barrier technologies are known to exacerbate AGD outbreaks (Wright et al. 2017) and was likely the case here with skirt cages. The provision of a freshwater lens pool to reduce populations of the freshwater-sensitive amoebic gill disease agent, Paramoeba perurans, has also been used to cope with AGD in snorkel cages (Wright et al. 2017). Effects of brackish salinities on AGD are likely to be stronger than those on host-attached salmon lice. Fish affected by AGD have significantly reduced P. perurans populations on gills after daily repeated 30 min and possibly shorter freshwater exposures (Wright et al. 2018). These effects were theorised to be caused from parasite removal from gill epithelia substrate rather than by cell death during salinity shocks (Lima et al. 2017, Wright et al. 2018). More brackish salinity exposures, potentially of shorter duration, could also have effects that are worth investigating to explore future use of the freshwater lens concept to control AGD.
Fish welfare was not significantly impacted by well cage operation compared to standard skirt cages. Instead lice treatments appeared to drive poor fish welfare, with the lowest overall SWIM score of 0.5 associated with a thermal delousing event. However, decreases in fish growth and condition in well cages were observed and may have resulted from initially spreading feed only within the inner freshwater lens pool to motivate a greater fish biomass into it. This was later rectified by spreading approximately two thirds of feed beyond the inner freshwater lens pool. Another possible explanation for lower growth may be that fish exposed to greater salinity variation in well cages had higher metabolic rates (Sardella and Brauner 2007). The slower growth partially explained the late harvesting of fish in well cages (note that high lice levels, repeated treatments and lower welfare likely contributed to early harvesting of the standard cages), which led to extra lice treatments in these cages at the end of the trial that risked poor fish welfare outcomes. This highlights the need to consider not only the direct effects of lice prevention technologies on fish welfare, but also their indirect effects on farm management in commercial scale operations.
5 - Conclusions and main findings
From this work, an ultimate conclusion on the effectiveness of well cage technology against salmon lice cannot be drawn. However, it is clear that less saline brackish water is needed in combination with higher residence times of fish to have a substantial reducing effect on lice levels on caged salmon. The lab scale trial suggested that to delay host-attached lice development < 12 ppt is required and to kill host-attached copepodids < 4 ppt is needed over durations of 3 hours or more.
Key findings:
-
In a commercial-scale salmon cage trial, lice levels and salmon welfare scores did not differ between duplicate well skirt cages with a freshwater lens pool and standard skirt cages over a 3-month period.
-
Skipping of an AGD treatment and continued use of a lice barrier skirt was linked to the use of a freshwater lens pool in one of the well skirt cages.
-
Salmon grew slower in well skirt cages compared to standard skirt cages, potentially linked to restricted spreading of feed exclusively within freshwater lens pools.
-
Acoustic tag monitoring of fish behaviour within well cages revealed variable residence in brackish salinity water < 19 and 26 ppt that typically equated to less than 3 hours per day, and no residence at brackish salinities < 12 ppt.
-
Preliminary echo sounder monitoring data from one well skirt cage suggests that underwater lights may be used to motivate fish into a freshwater lens pool during night periods.
-
Laboratory testing of brackish water salinities on the host-attached copepodid stage of salmon lice found < 12 ppt is needed to slow development rates and < 4 ppt is necessary to induce mortality over a minimum of 3 hours.
6 - References
Bricknell IR, Dalesman SJ, O’Shea B, Pert C, Mordue Luntz AJ (2006) Effect of environmental salinity on sea lice Lepeophtheirus salmonis settlement success. Diseases of Aquatic Organisms 71:201–212
Bui S, Oppedal F, Sievers M, Dempster T (2017) Behaviour in the toolbox to outsmart parasites and improve fish welfare in aquaculture. Reviews in Aquaculture DOI: 10.1111/raq.12232
CageEye AS (2018) Fish abundance analysis for “The Well”.
Grøntvedt RN, Kristoffersen AB, Jansen PA (2018) Reduced exposure of farmed salmon to salmon louse (Lepeophtheirus salmonis L.) infestation by use of plankton nets: Estimating the shielding effect. Aquaculture 495:865–872
Hamre LA, Bui S, Oppedal F, Skern-Mauritzen R, Dalvin S (submitted) Development of the salmon louse Lepeophtheirus salmonis parasitic stages in temperatures ranging from 3 to 24 °C.
Johnson SC, Albright LJ (1991) Development, growth, and survival of Lepeophtheirus salmonis (Copepoda: Caligidae) under laboratory conditions. Journal of the Marine Biological Association of the United Kingdom 71:425–436
Lima PC, Taylor RS, Cook M (2017) Pseudocyst formation in the marine parasitic amoeba Neoparamoeba perurans: a short-term survival strategy to abrupt salinity variation. Journal of Fish Diseases 40:1109–1113
Nilsen A, Nielsen KV, Biering E, Bergheim A (2017) Effective protection against sea lice during the production of Atlantic salmon in floating enclosures. Aquaculture 466:41–50
Oppedal F, Dempster T, Stien LH (2011) Environmental drivers of Atlantic salmon behaviour in sea-cages: A review. Aquaculture 311:1–18
Overton K, Dempster T, Oppedal F, Kristiansen TS, Gismervik K, Stien LH (2018) Salmon lice treatments and salmon mortality in Norwegian aquaculture: a review. Reviews in Aquaculture DOI: 10.1111/raq.12299
Sardella BA, and Brauner CJ (2007) “The osmo-respiratory compromise in fish,” in Fish Respiration and Environment, eds M. N. Fernandes, F. T. Rantin, M. L. Glass, and B. G. Kapoor (Boca Raton, FL: CRC Press), 147–165
Stien LH, Nilsson J, Hevrøy EM, Oppedal F, Kristiansen T, Lien AM, Folkedal O (2012) Skirt around a salmon sea cage to reduce infestation of salmon lice resulted in low oxygen levels. Aquaculture Engineering 51:21–25
Stien LH, Bracke MBM, Folkedal O, Nilsson J, Oppedal F, Torgersen T, Kittilsen S, Midtlyng PJ, Vindas MA, Øverli Ø, Kristiansen TS (2013) Salmon Welfare Index Model (SWIM 1.0): a semantic model for overall welfare assessment of caged Atlantic salmon: review of the selected welfare indicators and model presentation. Reviews in Aquaculture 5:33–57
Stien LH, Lind MB, Oppedal F, Wright DW, Seternes T (2018) Skirts on salmon production cages reduced salmon lice infestations without affecting fish welfare. Aquaculture 490:281–287
Tucker CS, Sommerville C, Wootten R (2000) The effect of temperature and salinity on the settlement and survival of copepodids of Lepeophtheirus salmonis (Krøyer, 1837) on Atlantic salmon, Salmo salar L. Journal of Fish Diseases 23: 309–320
Wright DW, Oppedal F, Dempster T (2016) Early-stage sea lice recruits on Atlantic salmon are freshwater sensitive. Journal of Fish Diseases 39:1179–1186
Wright DW, Stien LH, Dempster T, Vågseth T, Nola V, Fosseidengen J-E, Oppedal F (2017) ‘Snorkel’ lice barrier technology reduced two co-occurring parasites, the salmon louse (Lepeophtheirus salmonis) and the amoebic gill disease causing agent (Neoparamoeba perurans), in commercial salmon sea-cages. Preventive Veterinary Medicine 140:97–105
Wright DW, Geitung L, Karlsbakk E, Stien LH, Dempster T, Oldham T, Nola V, Oppedal F (2018) Surface environment modification in Atlantic salmon sea-cages: effects on amoebic gill disease, salmon lice, growth and welfare. Aquaculture Environment Interactions 10:255–265
Wright DW, Nowak B, Oppedal F, Crosbie P, Stien LH, Dempster T (2018) Repeated sublethal freshwater exposures reduce the amoebic gill disease parasite, Neoparamoeba perurans, on Atlantic salmon. Journal of Fish Diseases 41:1403–1410
7 - Dissemination
Non-peer-reviewed publications:
CageEye AS (2018) Fish abundance analysis for “The Well”.
Peer-reviewed publications:
Sievers M, Oppedal F, Ditria E, Wright DW (submitted) The effectiveness of hyposaline treatments against host-attached salmon lice. Scientific Reports
A second peer-reviewed publication by Wright et al. will be prepared to document aspects of the commercial trial using “well” cages, focusing on the salinity tag data gathered.
International presentation:
Sievers M, Wright D, Oppedal F (2018) Solving brackish salinity effects on salmon lice to understand self-treatment capabilities of wild and cultured salmon. Oral presentation. International sea lice conference 2018, Chile
Domestic presentation:
Wright D, Oppedal F, Dempster T, Stien L, Sievers M, Trengereid H (2018) Hyposaline treatment of salmon lice. Presentation to salmon lice experts, Bergen
Media release:
A press release covering all work conducted during the project will be prepared following the publication of the submitted article by Sievers et al.